Bitcoin Price at Crossroads: $84.2K Breakout or $80K Drop?
Key Takeaways
- •Bitcoin traded near $81,000 on October 16 after rebounding from a weekly low of $79,800 and was testing its 50-day moving average at $81,27 for support.
- •Trader Ardi said the local swing structure remains bearish until Bitcoin breaks above $84,200, with $82,000 and the $82,941 daily high as prior hurdles.
- •Analyst Jesse Olson warned that the daily chart remained bearish and that the session was trending toward the lowest candle close of the correction.
- •Daily Aroon readings stood at 0% upside and 92.86% downside, while the weekly RSI at 56.39 and a green weekly Supertrend near $66,812 indicated higher-timeframe momentum stayed positive.
- •CoinGlass data showed liquidation clusters between $84,300 and $84,700 overhead and support zones at $80,000 and $79,000–$79,500, while US September CPI rose 3.7% year over year.
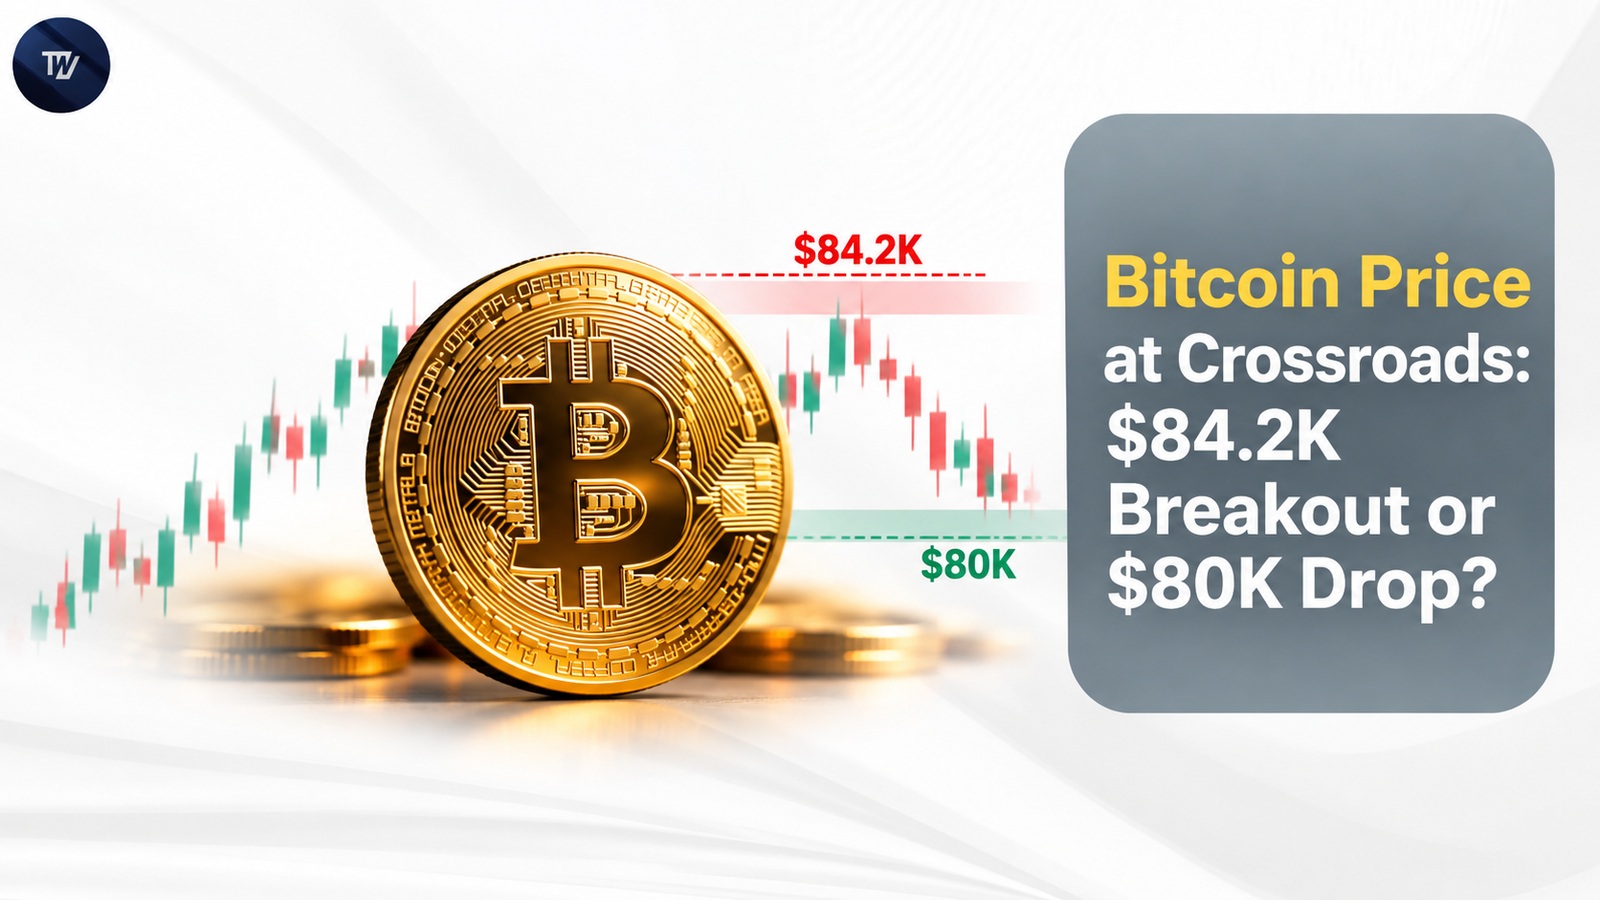
Bitcoin traded near $81,000 on October 16, holding its ground after rebounding from a weekly low of $79,800. The asset is testing its 50-day moving average for support, and traders are watching $84,200 as the threshold needed to challenge the short-term bearish trend.
Bitcoin has struggled to extend its rebound above $80,000. Since September's advance toward $87,000, recovery attempts have formed a sequence of lower highs, leaving the near-term structure tilted toward sellers.
Why Is $84,200 Important for Bitcoin Price?
Crypto trader Ardi highlighted the chain of lower highs in an X post on October 16, noting that buyers have yet to receive proof of a bullish reversal.
“Until we break above $84.2K, you have to respect that the local swing structure remains bearish,” Ardi said. A breakout above that level would lead him to consider buying BTC near the top of the range.
Before that can happen, the Bitcoin price must climb back above $82,000. The latest daily high near $82,941 serves as the next hurdle ahead of Ardi's breakout level.
Analyst Jesse Olson struck a more cautious tone on October 16. In an X post, he said the daily chart remained bearish and flagged the possibility of a new closing low.
$BTC remains bearish on the daily chart. Today is trending to have the lowest candle close of this correction. What will be the lowest price? pic.twitter.com/W2dGRZoJAl
— Jesse Olson (@JesseOlson) October 16, 2026
What Do Bitcoin's Moving Averages Show?
The Bitcoin price was trading near its 50-day moving average at $81,279, an indicator about $67 away from the prevailing level that has been rising since the recovery began in August. Moving averages smooth the mean of daily closes over their lookback window, and the 50-day line is among the most widely cited references for judging whether a medium-term trend is still intact.
Holding above this average would help sustain technical support nearby, while a fall below it would shift focus back to last week's low of $79,800.
Daily Aroon readings supported the negative short-term sentiment for BTC/USD. Aroon measures how recently the highest high and lowest low occurred within a set window. The upside reading stood at 0%, while the downside reading touched 92.86%, reflecting that the current low was more recent than the high within the 14-bar window.
Meanwhile, the 200-day moving average was positioned at $72,397, a slower line that many traders treat as a long-term trend benchmark. After their bullish cross, the shorter-period average sat above the longer-period indicator, meaning the Bitcoin price is testing the faster moving average rather than the slower 200-day line. A drop below $80,000 would signal a weakening of the recovery trend.
Can Weekly Indicators Support a Recovery?
The weekly relative strength index told a different story, printing 56.39 — above the 50 midpoint — against an average value of 51.80. The RSI is a momentum gauge that weighs the size of recent gains against recent losses. That reading indicated weekly momentum remained strong even as daily momentum deteriorated, though the RSI still sat below levels recorded during previous rallies.
The weekly Supertrend was also green, at around $66,812. Supertrend is a trend-following indicator that keeps its bullish state for as long as price stays above its band. With the Bitcoin price trading well above that level, the overall indicator remained positive throughout the daily correction.
Where Are the Main Liquidation Levels?
A one-week heatmap from CoinGlass, a tool that estimates where leveraged futures positions would be forcibly closed, depicted a high concentration of liquidation leverage overhead between $84,300 and $84,700, with a smaller estimated cluster between $83,300 and $83,700. These zones sit above the current Bitcoin price and near Ardi's breakout level. A move into the upper clusters could result in shorts being closed out, although the heatmap does not indicate direction; forced of this kind execute as market orders at those prices.
Beneath the price action, two concentration levels stood at $80,000 and at $79,000–$79,500. The lower cluster would come into view if the market moves under the weekly lows.
The latest US inflation figures added another risk factor for markets. According to the Bureau of Labor Statistics, the Consumer Price Index — the widely followed US inflation gauge that informs expectations around Federal Reserve interest rate policy — rose 3.7% annually in September, up from 3.4% the previous month.
This article contains market analysis and price predictions. These are not guarantees. Crypto markets are volatile. Always DYOR. Not financial advice.

