Bitcoin Outperforms Stock Market as Traders Watch Key Resistance Levels
Key Takeaways
- •Glassnode reported in posts on X that Bitcoin is currently outperforming the stock market, a pattern that has become less frequent recently.
- •Bitcoin is testing a key resistance range between $64,000 and $65,000, a zone that has historically defined its price movements.
- •Bitcoin's correlation with equities strengthened after U.S. regulators approved spot Bitcoin exchange-traded funds in January 2024.
- •Analysts track Bitcoin's relative performance using ratio charts against benchmark indices such as the S&P 500 to gauge whether the divergence persists.
- •Sustained outperformance versus stocks could attract increased interest from institutional and retail investors, while a breakout above resistance may signal more bullish sentiment.
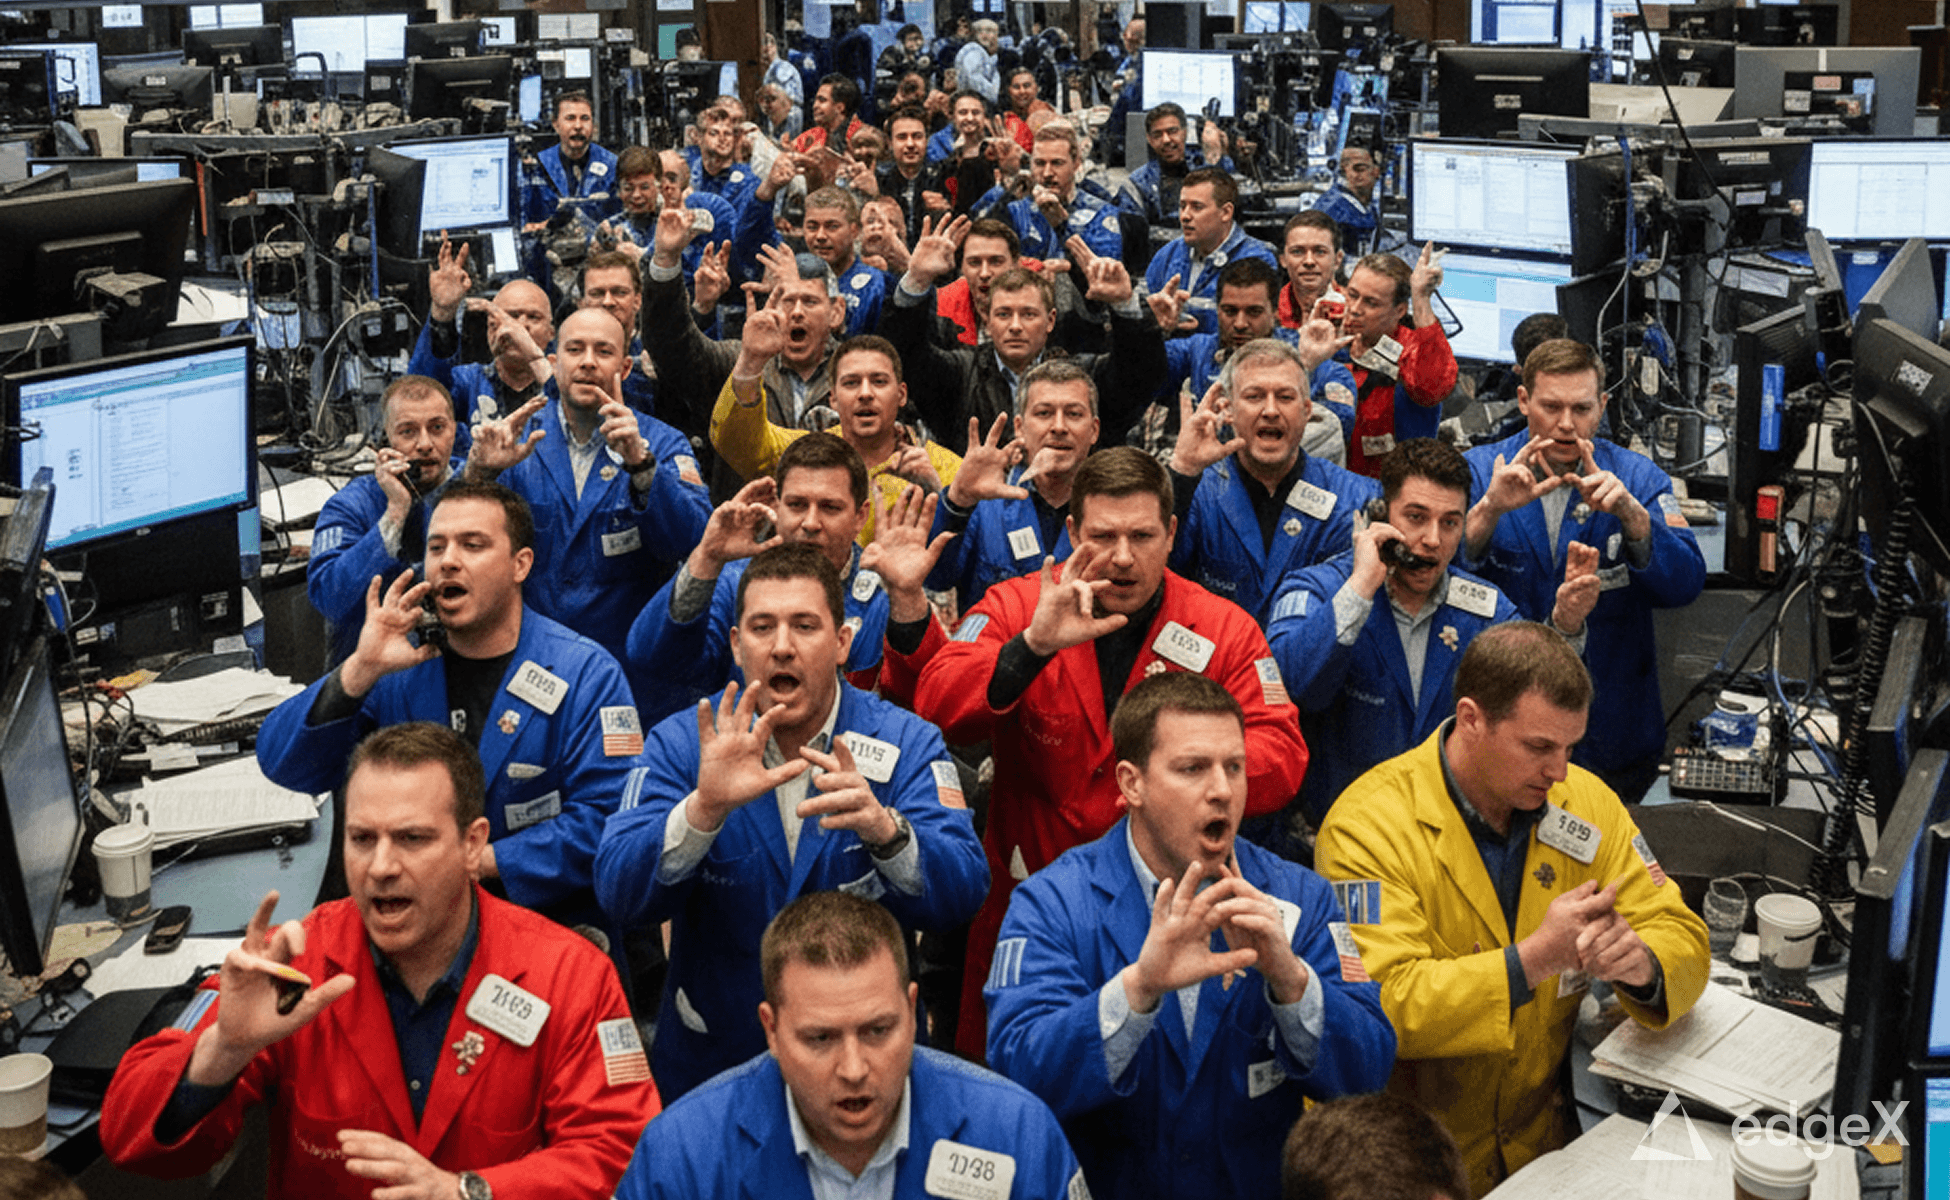
Bitcoin has recently demonstrated resilience by outperforming the stock market, according to posts on X by on-chain analytics firm Glassnode (@glassnode) (first post, second post). The development is noteworthy because such occurrences have become less frequent in recent times. Traders are closely monitoring this shift in dynamics, as it could signal a change in market sentiment and influence future trading strategies. The comparison carries weight because Bitcoin has in recent years traded with a meaningful positive correlation to equities, particularly technology-heavy indices, so stretches of divergence from stocks are watched closely as a gauge of how investors are positioning the asset relative to traditional risk markets.
Market Picture
The broader cryptocurrency market is currently exhibiting mixed signals, but Bitcoin's performance against the stock market stands out. With Bitcoin testing key resistance levels around $64,000 to $65,000, this outperformance could indicate a shift in trader sentiment. Analysts are observing how the dynamic could affect future trading volumes and price movements. The link between Bitcoin and conventional finance tightened after United States regulators approved spot Bitcoin exchange-traded funds in January 2024, vehicles that route traditional brokerage and advisory flows into the asset; since then, Bitcoin's relationship with stock indices has become a routine reference point in market commentary, making any sustained divergence more conspicuous.
Bitcoin's recent outperformance against the stock market marks a significant trend shift, and the change may impact trading strategies as market dynamics evolve. Analysts suggest that increased attention on Bitcoin could lead to heightened trading activity, while observers are particularly focused on whether the trend continues in the coming weeks. Bitcoin's market position is underscored by its historical performance at critical price levels.
Trading Range in Focus
Current market sentiment appears cautious as Bitcoin navigates the critical $64,000 to $65,000 range, which has historically defined its price movements. In technical analysis, a resistance level is a price zone where selling pressure has repeatedly emerged, which is why such areas serve as reference points for traders assessing whether an asset can advance further. Recent trading activity shows potential for increased volatility, particularly as traders react to Bitcoin's relative strength against stock indices. This could set the stage for significant price action in the near term, as participants weigh their positions based on the evolving market landscape.
Bitcoin is a decentralized digital currency that allows for peer-to-peer transactions without the need for intermediaries. Its performance is often compared against traditional financial markets, including the stock market, providing a barometer for investor sentiment in the crypto space. This comparison is important, as it reflects Bitcoin's growing influence and acceptance as an alternative asset class.
What Comes Next
Traders are watching for further developments in Bitcoin's performance relative to the stock market. Analysts commonly track this relationship through ratio charts that measure Bitcoin against benchmark equity indices such as the S&P 500, offering a standardized way to observe whether the divergence extends or fades. A sustained outperformance could lead to increased interest from institutional investors and retail traders alike, while any signs of weakness in the trend may prompt a reassessment of positions. Analysts recommend keeping an eye on key resistance levels, as any breakout could signal a more bullish sentiment overall.
The cryptocurrency market is highly volatile, and past performance is not indicative of future results.
Originally published by Coinfomania.

