Bitcoin Holds Near $78,000 as Capital Inflows Recover Despite ETF Outflows
Key Takeaways
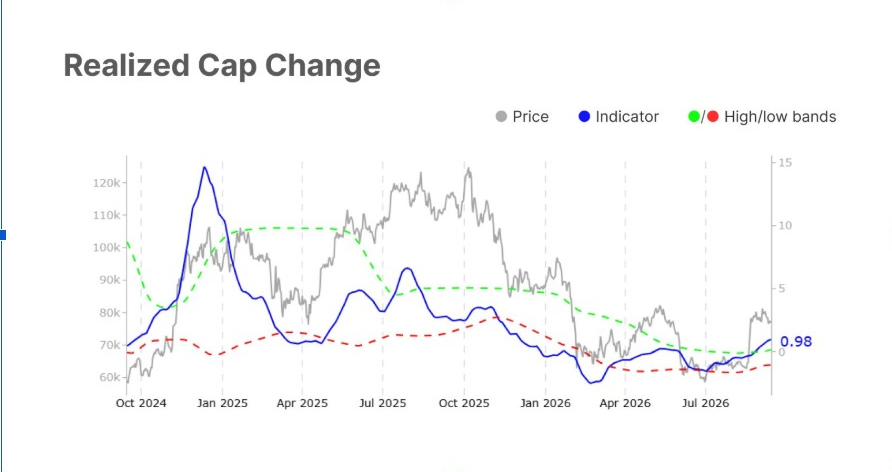
- •Bitcoin’s Realized Cap Change indicator recovered to 0.98 after falling below zero earlier in 2026.
- •A 10x Research miner indicator has produced buy signals in eight of its last 10 occurrences, with a 58.6% median return in those cases, although its history is limited.
- •Bitcoin moved above the $77,400 range boundary, but maintaining that level is necessary to support a stronger short-term recovery.
- •The $79,800 level and the broader $80,000-$82,000 zone remain significant resistance areas.
- •Bitcoin is attempting to reclaim its 50-week EMA after closing below it, with a rejection potentially turning the average into resistance.
Bitcoin held near $78,000 after a difficult week for spot demand, while exchange-traded fund (ETF) outflows and selling in derivatives markets continued to limit its recovery. BTC remained below $80,000 but avoided a deeper breakdown as on-chain capital measures improved and buyers absorbed supply within the established trading range. The divergence between recovering on-chain inflows and continued selling through other market channels leaves both demand and resistance levels important to monitor.
A Bitcoin miner indicator tracked by 10x Research has also flashed a buy signal. The signal has turned positive in eight of its last 10 occurrences, producing a median return of 58.6% in those instances. Its historical record is limited, however, and previous signals have not always resulted in gains.
Bitcoin Capital Inflows Recover
Bitcoin capital inflows have begun to recover after weakening through much of 2026. The Realized Cap Change indicator has risen to 0.98, moving back above the neutral area after falling below zero earlier this year as capital left the market.
The latest increase indicates that fresh capital is entering Bitcoin even though its price remains well below previous cycle highs. The current increase is more measured than the sharp inflow periods recorded in late 2024 and early 2025, when the indicator rose much higher as BTC advanced through stronger upward trends.
Capital inflows have returned, but they have not yet reached the levels seen during those earlier rallies. Bitcoin has also held near $78,000 despite continued selling across spot and perpetual markets. ETF outflows have added another source of pressure, but those flows have not been followed by a deeper price breakdown.
BTC Tests a Short-Term Range Break
Bitcoin has moved above the upper boundary of its recent short-term range. BTC traded near $77,700 after moving through the area around $77,400, which had limited earlier recovery attempts.
Market analyst BitBull said Bitcoin is attempting to flip its short-term trend. For the structure to strengthen, price needs to remain above the former range boundary. A move back below that area would put BTC back inside the previous consolidation.
The hourly chart also shows how quickly sellers can return. Bitcoin briefly surged toward $79,300 on September 11 before reversing most of the move. Trading volume increased sharply during that session, indicating active participation around the attempted breakout.
A larger resistance area is located near $79,800. Bitcoin would need additional buying pressure to reach that zone and sustain a move above it. Until then, the market remains within a broader range.
Weekly 50-Week EMA Remains a Key Test
Bitcoin faces a separate test on the weekly chart after recently closing below its 50-week exponential moving average (EMA). The average now sits above the current market area. Its previous role as support means the close has changed the technical structure.
The current weekly candle is attempting to reclaim the 50-week EMA. A sustained recovery above the average would reduce the immediate pressure created by the earlier breakdown. A rejection, however, could turn the EMA into resistance and keep sellers active.
Rekt Capital noted that an upside wick followed by a weekly close below the EMA would confirm a bearish retest. Bitcoin therefore needs more than an intraday move above the average. The weekly close should provide a clearer indication of whether buyers have regained that level. Alongside the $77,400 range boundary and the $79,800 resistance area, the weekly EMA gives the market separate short-term and higher-timeframe levels to watch.
A broader resistance zone is also located between $80,000 and $82,000. Bitcoin has struggled to establish weekly closes above this area during recent recovery attempts.
Longer-Term Structure Remains Intact
Bitcoin continues to trade well above the major lows recorded earlier in 2026. A longer-term trading setup identifies the $59,000 to $60,000 region as the first major swing area, while another level is positioned near $76,200. BTC currently trades above both zones.
The same setup places another potential swing area near $85,000, although Bitcoin would first need to clear the current weekly resistance. It also maps a much higher long-term target near $160,000. Current price action has not confirmed that path.
This article is for informational purposes only and does not constitute financial or investment advice. Cryptocurrency investments involve risk, and historical indicator performance does not guarantee future returns. Readers should conduct their own research before making investment decisions.
Primary source references: Glassnode on X, BitBull on X, and Rekt Capital on X.

