Bitcoin Price Outlook: $80K BTC Support Faces Test as MVRV Falls
Key Takeaways
- •Bitcoin is trading near $81,500 after an attempted breakout was rejected around $87,000, leaving the price consolidating within a narrow $81,000–$82,000 range.
- •Bitcoin's MVRV has fallen to the 25.7th percentile, dropping below the 30th percentile threshold that on-chain analyst Darkfost associates with an established accumulation zone.
- •Bitcoin has historically spent only about 25% of its time in this valuation range, which remains above the extreme undervaluation levels typically recorded at market bottoms.
- •A recovery above the 200-day moving average would support the bullish case, although it would not by itself confirm a sustained trend reversal.
- •According to analyst Maison Cypher, a test of the $80,000 support level could weaken the short-term outlook and expose Bitcoin to a deeper decline.
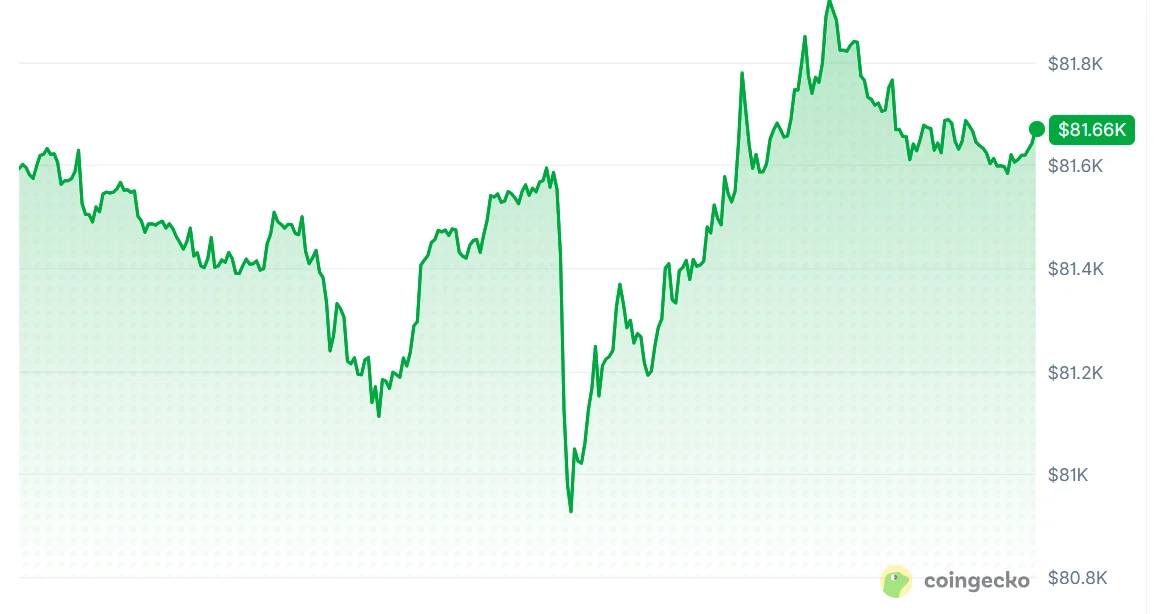
Bitcoin is trading near $81,500 after its latest attempt to break higher was rejected near $87,000, leaving the market consolidating in a narrow range as on-chain data points to a potential accumulation zone. CoinGecko data puts BTC at $81,546.13, up 0.02% over the past 24 hours but down 1.79% over the past seven days. Trading volume reached $14.92 billion over the past 24 hours.
Two complementary analyses published on October 18 frame the current market: on-chain analyst Darkfost's reading of Bitcoin's MVRV percentile and technical analyst Maison Cypher's map of the key short-term price levels.
MVRV Falls Back Below 30th Percentile, Pointing to a Potential Accumulation Zone
Darkfost's analysis focuses on Bitcoin's MVRV percentile rather than the raw MVRV ratio alone. MVRV — short for Market Value to Realized Value — compares Bitcoin's market capitalization with its realized capitalization, which estimates the value of coins using the prices at which they last moved on-chain. Because realized capitalization is widely read as a proxy for the aggregate cost basis of existing holders, the ratio helps gauge how current prices compare with what the market paid for its coins. The percentile approach places the current reading within Bitcoin's historical valuation distribution, helping analysts assess whether BTC trades at a relatively high or low valuation compared with previous periods.
Bitcoin is back below the MVRV 30th percentile (25.7%) after being rejected near $87,000. It is therefore re-entering a transitional phase following a capitulation episode. This chart is not simply showing the raw MVRV, which compares Bitcoin's market cap, calculated as price… pic.twitter/UoD7Dkq1QH
— Darkfost (@Darkfost_Coc), October 18, 2026, on X
According to Darkfost, Bitcoin's MVRV has dropped below the 30th percentile, with the current reading at 25.7%. He frames the market as re-entering a transitional phase following a capitulation episode, a term that describes a stretch in which coins are sold at a loss. The reading suggests BTC has returned to a historically lower valuation range. Bitcoin has spent only around 25% of its time in this valuation range, making the current condition relatively uncommon, although it remains above the extreme undervaluation levels historically associated with market bottoms. Darkfost describes this level as consistent with an established accumulation zone.
The analyst nevertheless distinguishes this zone from the extreme undervaluation that has historically coincided with market lows. The distinction matters because a low MVRV percentile does not guarantee an immediate recovery. Instead, it provides historical context for investors assessing Bitcoin's valuation during a period of market weakness.
Price Faces a Key Test at $80,000 Support
Bitcoin's immediate direction remains uncertain as the price struggles to leave its narrow trading range. According to Maison Cypher, the market is still consolidating between $81,000 and $82,000, and further consolidation is expected before the market attempts a decisive move.
$BTC : Continuing consolidation
Over the past day, no particular changes occurred with the asset — we settled into a fairly narrow sideways range between $81,000 and $82,000, and today it's also unlikely that we'll be able to break out of it. We're waiting for the start of the… pic.twitter.com/TpJMQh7SI2— Maison Cypher (@MaisonCypher), October 18, 2026, on X
Cypher identifies the 200-day moving average (MA200) — a long-term trend indicator commonly used to judge whether an asset is in a broader uptrend or downtrend — as an important level for buyers seeking to restore upward momentum, and traders are watching whether buyers can push Bitcoin back above it. A recovery above this moving average would support the bullish case, although it would not confirm a sustained trend reversal.
Conversely, a move toward $80,000 could increase downside risks. Cypher warns that a test of $80,000 support could weaken the short-term outlook and expose BTC to a deeper decline, though no specific downside target has been provided.
Context Rather Than a Confirmed Signal
The two sets of levels measure different market conditions. MVRV percentiles describe Bitcoin's valuation relative to historical levels, while support zones and moving averages help traders assess price behavior. For investors, the combination offers context rather than a confirmed trading signal.
Bitcoin's position below the 30th MVRV percentile may interest longer-term accumulators, while short-term traders still face uncertainty. The market is trading in a historically low valuation range while struggling to regain upward momentum: a move above the MA200 could strengthen recovery hopes, whereas a break below $80,000 would raise downside concerns.
Based on reporting by Blockonomi.

