Bitcoin Fell Before Every Past US Midterm – Will 2026 Repeat It?
Key Takeaways
- •Bitcoin fell in the August-to-September periods before the 2014, 2018 and 2022 U.S. midterm elections, and each of those years also saw negative fourth-quarter returns.
- •The article says Bitcoin’s historical cycle lows have tended to arrive 26 to 30 months after each halving, which places previous bottoms near midterm elections by coincidence rather than causation.
- •Bitcoin’s quarterly performance in 2026 is described as consistent with a late-cycle drawdown, with losses in Q1 and Q2 followed by a Q3 rebound as of July 30.
- •Spot Bitcoin ETFs, approved in January 2024, are presented as a new structural factor that ties Bitcoin more closely to traditional portfolios and macro conditions.
- •The article identifies renewed conflict around the Strait of Hormuz and higher energy prices as the main near-term risk because they could keep inflation and interest rates elevated.
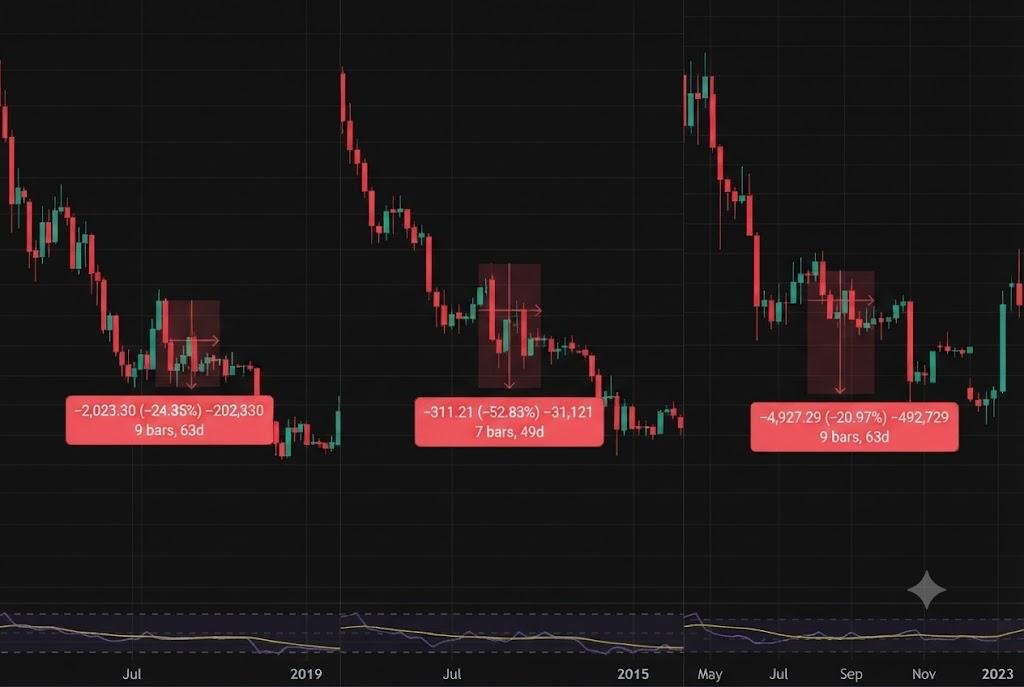
Three observations do not constitute a statistically significant pattern. Three consecutive declines can occur by chance often enough that the record alone proves nothing, and the measurement windows are not even identical: the 2018 and 2022 ranges span nine weekly candles, while 2014 covers only seven.
What makes the record worth examining is that a mechanism does connect Bitcoin to the midterm calendar — one that has nothing to do with voting.
What the Three Cycles Actually Show
Bitcoin fell approximately 53% in 2014, 24% in 2018, and 21% in 2022 during the August–September periods preceding U.S. midterm elections.
Fourth quarters were negative all three times: −16.7%, −42.2%, and −14.8%.
TradingView measurements across the highlighted late-summer windows show:
- 2014: $590 to $280, a 53% loss.
- 2018: $8,300 to $6,290, down 24%.
- 2022: $23,500 to $18,570, down 21%.
CoinGlass quarterly data extends the picture into October through December, covering the final campaign month and election day:
- Q4 2014: −16.7%
- Q4 2018: −42.2%
- Q4 2022: −14.8%
Fourth quarters are usually Bitcoin's strongest period, though the historical averages are inflated by triple-digit rallies from a market a fraction of today's size. The simpler observation: BTC was falling before voters reached the polls and kept falling afterward, in all three cases.
Halvings and midterms both run on four-year cycles, placing every bear-market bottom in a midterm year. Bitcoin is down 22.2% in Q1 and 14.1% in Q2 2026, consistent with a late-cycle bottom rather than an election effect.
Two Four-Year Clocks Running in Step
Bitcoin halvings — the programmed reductions in the rate at which new Bitcoin enters circulation, cutting miner rewards by half — occurred in November 2012, July 2016, May 2020, and April 2024. Midterm elections fall in November 2014, 2018, 2022, and 2026. Both intervals are four years long, which locks them into a fixed relationship.
Bitcoin's floors have historically arrived 26 to 30 months after each halving. Applied to the dates above, that places the low in January 2015 at $155, December 2018 near $3,160, and November 2022 around $15,550. Each of those lands on or immediately after a midterm election.
The August–September declines and negative fourth quarters were the closing stage of three bear markets, timed by the halving schedule rather than the electoral one. Two calendars four years apart will most likely continue to align, and the alignment carries no causation in either direction. That late-stage weakness reflected seller exhaustion reaching its end point.
What the Halving Reading Predicts for 2026
Treating the record as electoral produces one expectation: another decline into November. Treating it as halving-driven produces a different one. April 2024 plus the historical 26-to-30-month interval places this cycle's floor somewhere in mid-to-late 2026.
Bitcoin's quarterly returns fit that timeline. BTC lost 22.2% in Q1 and 14.1% in Q2 before gaining 9.3% in Q3 as of July 30, having fallen roughly half from its October 2025 peak. That is the shape of a market working through the end of a drawdown, not one anticipating an election.
The distinction matters for what happens after November. An election-driven reading implies pressure lifting once results are known. A halving-driven one implies the floor forms when selling exhausts itself, whatever the calendar says.
Each Midterm Also Carried Its Own Disaster
The timing explains the shape. Specific crises explain the depth.
Bitcoin entered the 2014 window after the failure of Mt. Gox, which had handled a substantial share of global BTC trading. Its collapse removed a major source of liquidity and exposed how dependent the young market remained on a handful of centralized exchanges.
By 2018, the market was still unwinding the speculative boom that peaked in late 2017, with the ICO market collapsing and retail demand evaporating.
November 2022 brought the failure of FTX, which accelerated an existing bear market. The SEC later alleged customer funds had been diverted to Alameda Research while FTX concealed the relationship.
Those were structural failures inside a market dominated by retail speculation, leverage, and crypto-native intermediaries. Any one of them would overwhelm an election as a price driver.
Spot ETFs Broke One Link in the Chain
No previous midterm period included U.S. spot exchange-traded products. The SEC approved them in January 2024, opening a regulated route for advisers, asset managers, and brokerage clients. By the time midterms arrive in November 2026, ETFs will have been absorbing and releasing capital for nearly three years, making this the first cycle in which Bitcoin's marginal buyer and seller are as likely to be a portfolio manager rebalancing exposure as a crypto-native trader.
ETFs offer no protection against a 20% or 30% decline, and they transmit redemptions as efficiently as they attract inflows. What they change is the source of pressure. Bitcoin now trades inside traditional portfolios alongside equities, bonds, and commodities, which reduces its exposure to any single exchange failing and increases its sensitivity to Treasury yields, real rates, oil, and global liquidity.
The crises that deepened the previous three drawdowns were crypto-native. The forces most likely to deepen this one are macro.
Energy Prices Are the Live Risk
The Iran conflict is the more direct threat to Bitcoin before November.
A June agreement reopened the Strait of Hormuz, the narrow channel through which roughly a fifth of global oil supply normally transits, and increased shipping traffic, letting the U.S. Energy Information Administration lower its oil-price forecasts, with production and trade flows expected near pre-conflict levels by the end of 2026.
The situation remains fragile. U.S. strikes resumed in July, and according to Reuters, Ipsos polling found 79% of Americans expecting military involvement to continue for an extended period, with 60% expecting the conflict to worsen gasoline prices over the following year.
The transmission runs through energy and monetary policy: renewed disruption at Hormuz restricts oil supply, higher energy and transport costs feed inflation, persistent inflation limits the Federal Reserve's room to cut, and higher-for-longer rates constrain the liquidity available to risk assets.
Bitcoin can absorb a military headline in a single session. Months of elevated energy prices under restrictive policy are harder to shrug off. BTC had already fallen roughly 50% from its peak before the conflict started, leaving fewer leveraged positions to liquidate. Surviving an initial shock is a different test from trading for months under inflationary pressure.
Gridlock Might Hit Altcoins, Not Bitcoin
The next federal general election falls on November 3, 2026. A July Washington Post/Ipsos poll found the economy and high prices cited most often as vote drivers, at 54% of registered voters, with Iran, Israel, and foreign policy at 20%.
Decision Desk HQ's July forecast gives Democrats a 62% chance of taking the House and Republicans a 57% chance of holding the Senate, making divided control the likeliest outcome.
Bitcoin already has regulated spot products and an established route into U.S. portfolios. Many altcoins, exchanges, and token issuers are still waiting for Congress to define whether their assets fall under SEC or CFTC oversight.
The Digital Asset Market Clarity Act passed the House 294-134 in July 2025, and the Senate Banking Committee advanced it 15-9 on May 14, with Democrats Ruben Gallego and Angela Alsobrooks joining all 13 Republicans. It now awaits a floor vote, expected to merge first with a related bill from the Senate Agriculture Committee. The legislation would establish a framework classifying digital assets as commodities or securities based on their degree of decentralization, giving developers and exchanges a testable path to compliance.
Gridlock is not good for Bitcoin. It is simply worse for everything else. Passage might flip that dynamic. Clearing the Senate would remove the classification question, and sentiment tends to respond to resolved uncertainty more than to any particular rule. Bitcoin would gain from the broader risk appetite; altcoins and U.S. crypto businesses would gain from the substance.
What Could Confirm or Break the Reading
The halving explanation strengthens if Bitcoin's Q3 recovery holds through the autumn until the end of the quarter and a durable floor forms in late 2026 regardless of the election result. It weakens if BTC gives back the Q3 gain and keeps falling well into 2027, which would place the drawdown outside the historical 26-to-30-month window.
Watch for sustained ETF outflows, renewed disruption at Hormuz, rising inflation expectations, or another crypto insolvency. Any of those could deepen the decline through channels unconnected to either calendar.
If Bitcoin falls again before and after November, the midterm will be the date attached to it. The halving clock and the oil price may explain the size.
This article is for informational purposes only and does not constitute financial or investment advice. Three historical observations cannot establish a reliable pattern, and past cycle behavior does not predict future prices.
Methodology: Late-summer price measurements come from TradingView weekly charts; quarterly returns from CoinGlass. Halving dates and cycle bottom prices are from the public blockchain record. Polling figures are from Ipsos and Washington Post/Ipsos surveys, forecast probabilities from Decision Desk HQ, and legislative status from congress.gov.

