Bitcoin Holds $74,000 Through a Third Day of ETF Outflows: Is the Bottom In for BTC?
Key Takeaways
- •U.S. spot Bitcoin ETFs recorded a third straight day of net outflows on Monday, losing $201 million, though the figure was roughly half of Friday's total.
- •BlackRock's IBIT saw $213 million in withdrawals, exceeding the entire group's net outflow, while Morgan Stanley's MSBT was the sole fund with inflows of about $22 million.
- •Strategy purchased 1,037 BTC last week, raising its total holdings to 850,364 BTC, roughly 4% of Bitcoin's fixed 21 million coin supply cap.
- •MARA Holdings has sold 13,597 BTC since October 1, adding to sell-side pressure alongside continued ETF redemptions.
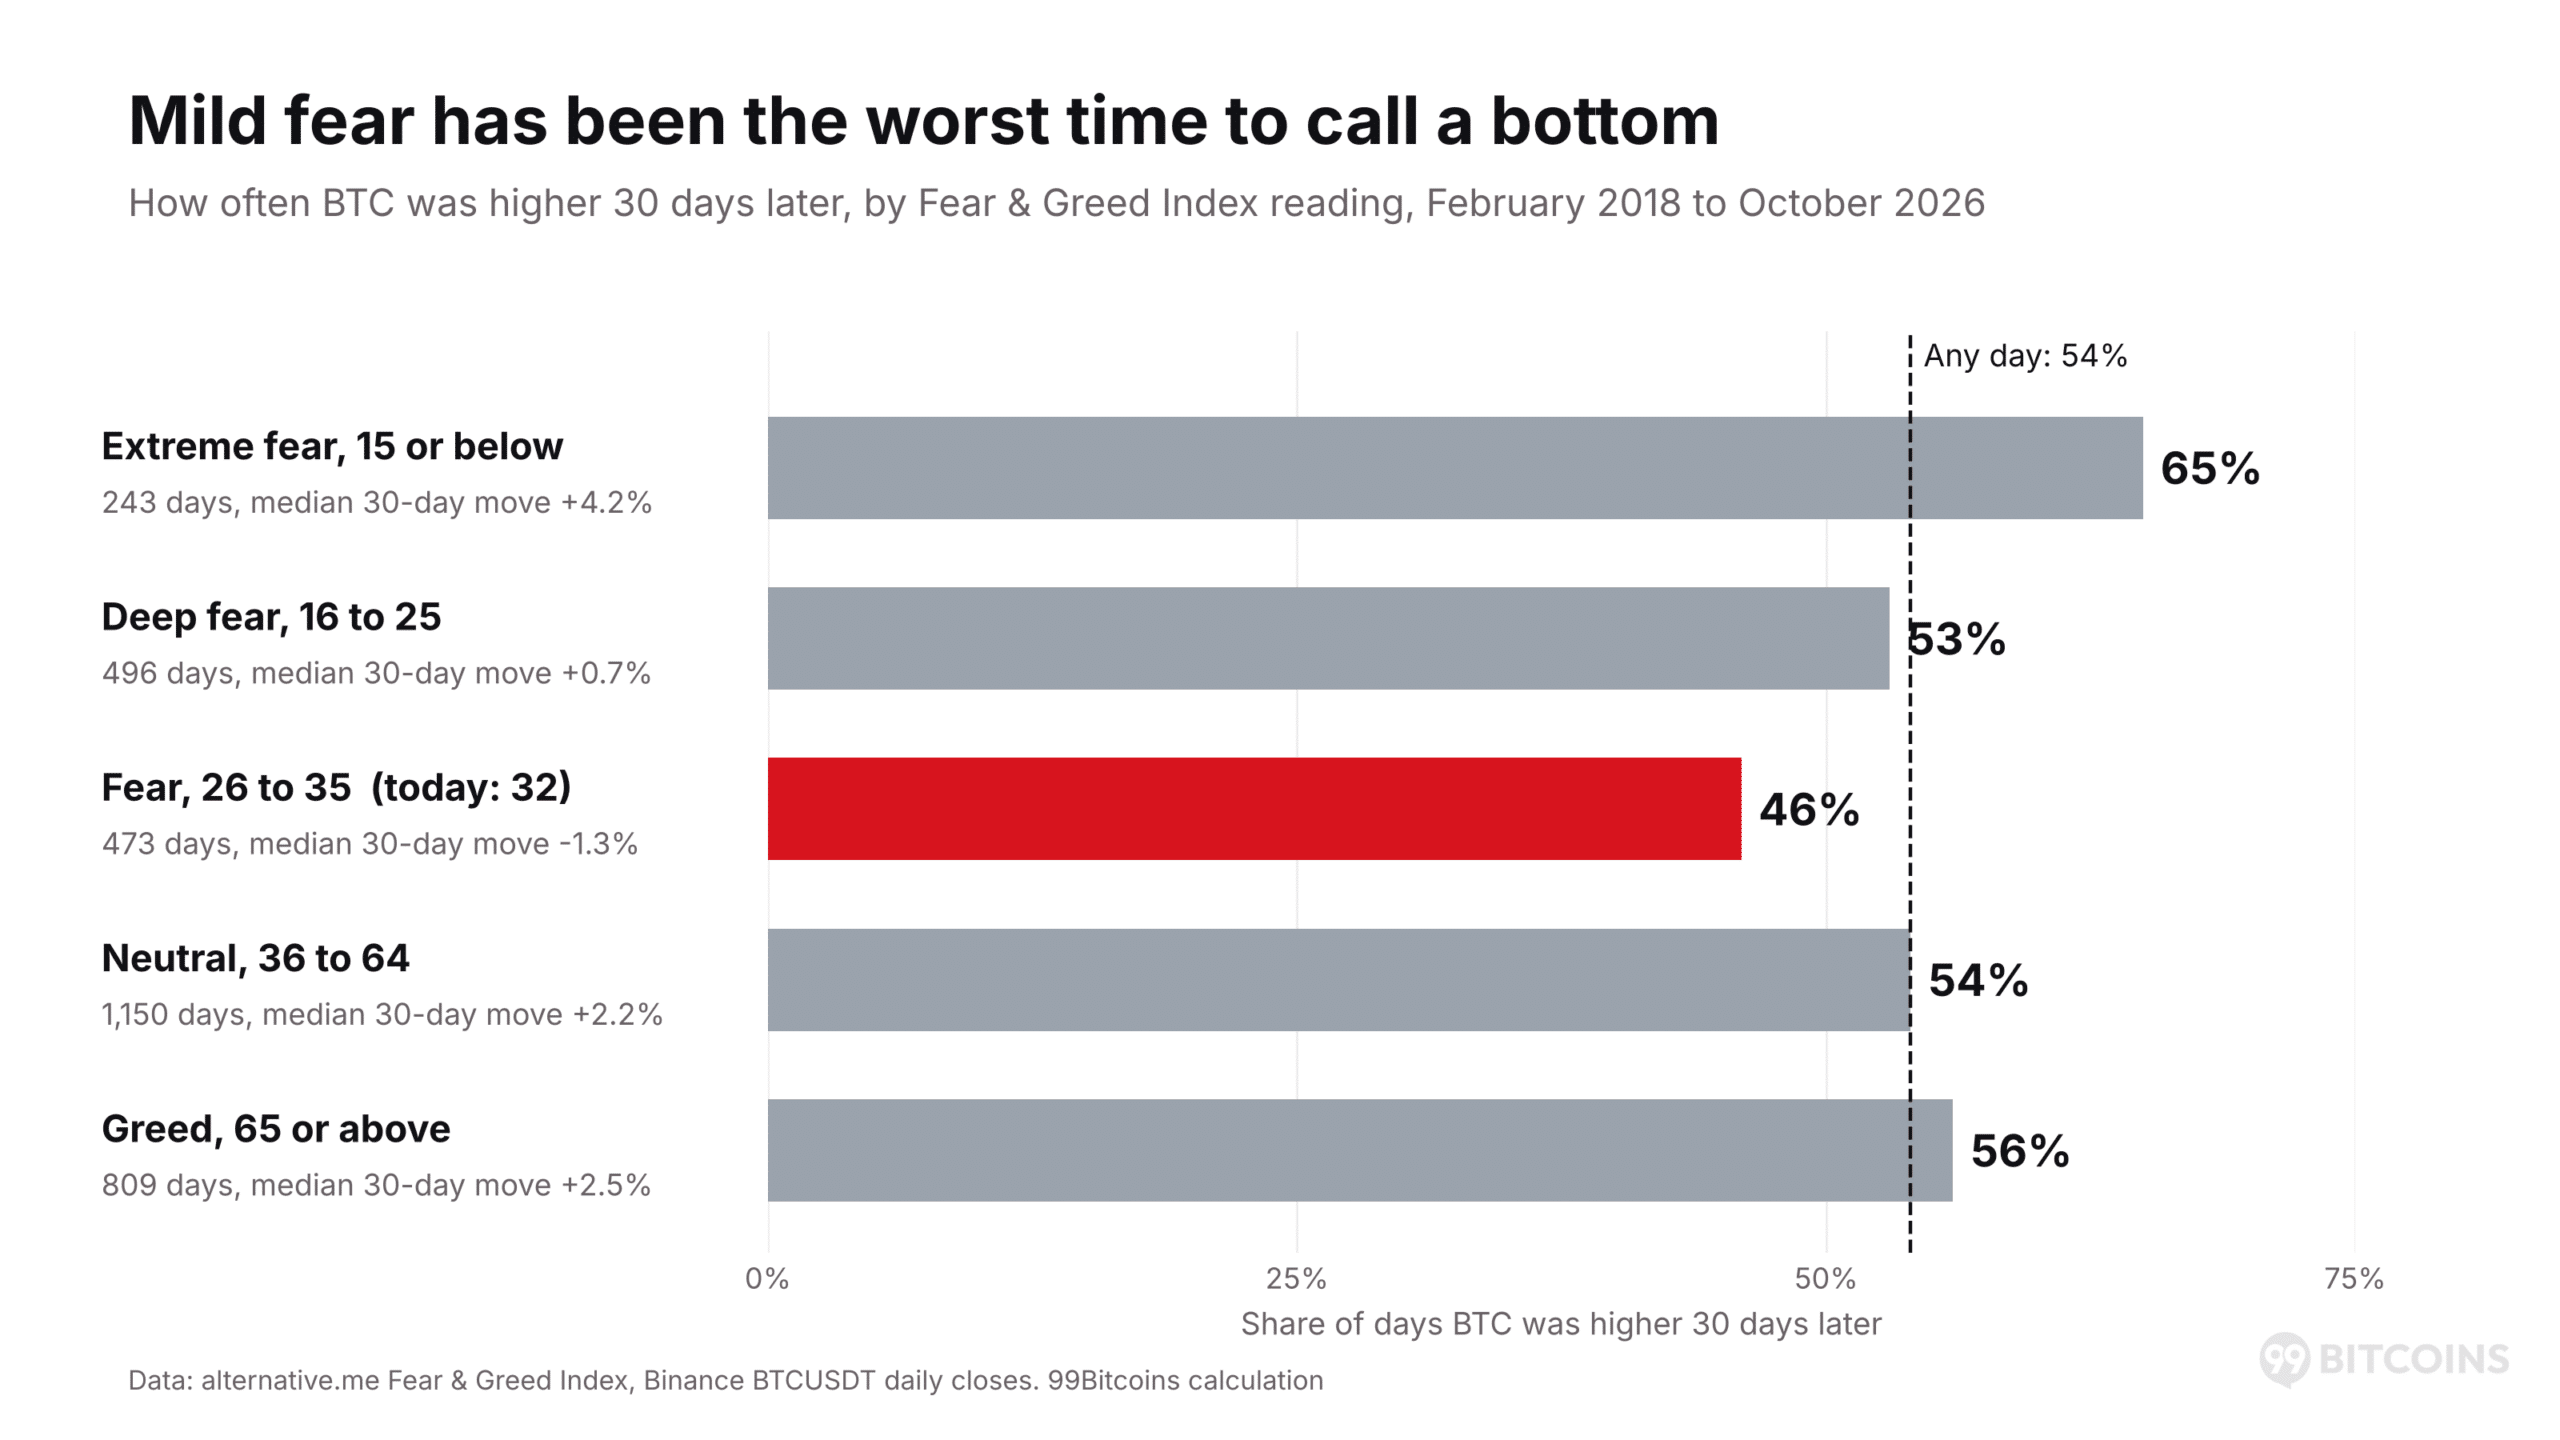
- •The Fear & Greed Index reading of 32 falls in a range that, since 2018, has seen Bitcoin higher 30 days later only 46% of the time.
Bitcoin (BTC USD) is holding near $74,500 on Tuesday after U.S. spot Bitcoin exchange-traded funds (ETFs) logged another day of net outflows. Investors pulled a combined $201 million from the funds on Monday, the third consecutive day of exits, with BlackRock's IBIT accounting for $213 million of that total — more than the group's entire net figure.
Not every large holder is selling. Strategy, the largest corporate holder of Bitcoin, kept buying, adding 1,037 BTC last week to lift its total holdings to 850,364 BTC.
Saylor bought $81.9M of BTC and $188.3M of STRC. Strategy now holds $63.42B of BTC, purchased at an average price of $75,456. Saylor still holds $4.9B USD, and can buy back up to $560M of STRC under the current repurchase program. pic.twitter.com/ZPUuzCZEZt
— Arkham (@arkham) November 10, 2026
Bitcoin has held above Sunday's low of $73,510 since Sunday night, and some traders are already calling it a bottom. The Fear & Greed Index, a daily gauge of market mood scaled from 0 to 100 that blends volatility, market momentum, social media activity, Bitcoin's dominance and search trends, currently reads 32 — a level classified as fear.
Historical data adds a caveat to that call: since 2018, on days when the index sat between 26 and 35, BTC was higher 30 days later only 46% of the time, the worst record of any sentiment range. The question for now: has Bitcoin found its bottom?
ETF Investors Pulled Money for a Third Straight Day
The selling has slowed but not stopped. Monday's $201 million outflow was roughly half the size of Friday's, but it extended a run of daily exits that began last Thursday, according to SoSoValue data.
The swings underline how quickly money has moved in and out of the products since they began trading in January 2024, a category that has turned daily flow data into one of the most closely watched gauges of crypto demand.
The flows broke down as follows:
- BlackRock's IBIT: $213 million out — more than the whole group's net total.
- ARK 21Shares' ARKB: $9.9 million out.
- Morgan Stanley's MSBT: the only fund to take in new money, about $22 million.
The week before was worse. The funds lost a net $1.28 billion between November 2 and 6, with IBIT behind $1.21 billion of it.
ETF flows matter for the price. When investors pull money from a spot ETF, the fund sells Bitcoin to pay them, so steady outflows translate into steady selling.
Strategy Buys While Miners Sell
Strategy took the other side of the trade. Its 1,037 BTC purchase was worth about $77 million at Tuesday's price, and the company's own tracker now shows 850,364 BTC — roughly 4% of all Bitcoin that will ever exist, given the cryptocurrency's fixed supply cap of 21 million coins. The firm keeps buying in small steps, having added 2,698 BTC since the quarter began on October 1, according to its tracker.
Other buyers are active as well. A new wallet withdrew 1,489 BTC, worth about $111 million, from the custodian BitGo on Tuesday, on-chain analytics service Lookonchain reported. Three more new wallets took roughly 1,003 BTC off Binance over the past day. Coins leaving exchanges for private wallets usually belong to buyers planning to hold.
Miners, by contrast, have been selling into the weakness. MARA Holdings, one of the largest Bitcoin miners, moved out another 500 BTC on Tuesday and has sold 13,597 BTC since October 1, Lookonchain reported. Together with ETF redemptions, those miner sales add to the amount of Bitcoin changing hands during the pullback.
Fear Readings Like Today's Have Not Marked Bottoms
Fear alone is not a buy signal. To see how readings like Tuesday's have played out, 99Bitcoins matched every daily reading of the Fear & Greed Index since February 2018 with BTC's price 30 days later on Binance — 3,171 days in all. The results:
- Extreme fear, 15 or below: BTC was higher 30 days later 65% of the time, with a median gain of 4.2%.
- Fear, 26 to 35, where the index sits now: BTC was higher only 46% of the time, with a median loss of 1.3%.
- Any day: BTC was higher 54% of the time.
This year's low fits the pattern. When BTC bottomed at $57,800 on July 1, the index read 11 — deep in extreme fear. Today's 32 is mild by comparison.
The data cannot rule out a bottom at $73,510. It does show that bottoms have usually come when fear was much deeper than it is now.
Price Analysis: Can Bitcoin Hold $73,510?
So far it has, but it has not bounced far. BTC trades at $74,467 on Binance, about 1.3% above Sunday's low.
On the four-hour chart — where each candle covers four hours — Bitcoin sits below both of its simple moving averages (SMAs), the plain average of the last 50 or 200 closing prices, a posture traders generally read as a sign that short-term momentum has cooled. The 50-period SMA stands at $76,660 and the 200-period SMA at $80,188, according to the BTCUSDT 4H chart on Binance.
- Resistance: $75,568 (Monday's high), then $76,660 (the 50-period SMA), then $80,188 (the 200-period SMA).
- Support: $73,750 (Monday's low), then $73,510 (Sunday's low), then $73,027 (the August 21 low).
For BTC USD, the next signal comes with Tuesday's ETF flows. A fourth day of outflows would mean the funds are still selling, while a return to inflows would give the $73,510 low a better chance of holding.
This article was originally published on 99Bitcoins.

