Bitcoin Futures Carry Outpaces Treasuries at 7.89% as Spot Bitcoin ETFs Draw $853M Weekly
Key Takeaways
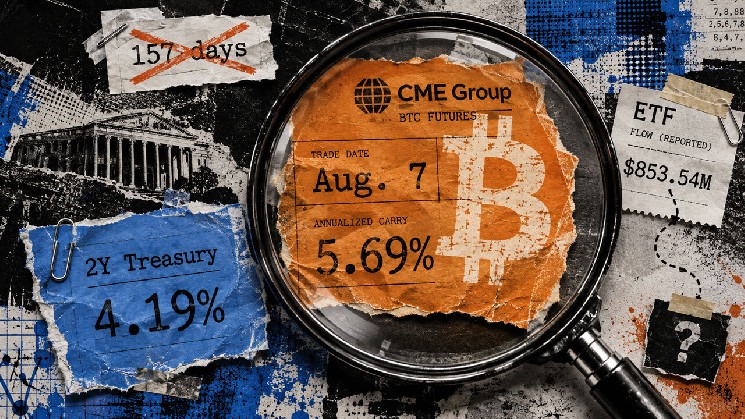
- •A matched-date calculation for Aug. 7 showed Bitcoin futures carry above the two-year Treasury yield of 4.19%.
- •The August CME Bitcoin futures contract posted the highest gross annualized basis at 7.89%, while the September and December contracts were lower.
- •The article says the Aug. 7 reading breaks the claimed 157-day streak of Bitcoin futures underperforming Treasuries, based on comparable CME and BRRNY inputs.
- •U.S. spot Bitcoin ETFs recorded $853.54 million in net inflows during the week ended Aug. 7, with positive flows in every trading session.
- •The piece says aggregate ETF and CFTC data do not identify whether a specific spot Bitcoin ETF purchase was hedged with a futures short.
Bitcoin Futures Carry Outpaces Treasuries at 7.89% as Spot Bitcoin ETFs Draw $853M Weekly
Synchronized CME and Treasury market data from Aug. 7 indicates that Bitcoin futures carry trades yielded above comparable U.S. government debt, challenging a widely circulated comparison across crypto markets suggesting otherwise. The comparison had gained traction because the futures basis is one of the few real-time gauges of institutional arbitrage activity in Bitcoin, and its level relative to risk-free rates is widely read as a signal of how much dedicated arbitrage capital is deployed in the market.
Analyst Marc Baumann placed the annualized Bitcoin futures basis near 3% and the two-year Treasury yield at 3.8%, asserting that the crypto spread had lagged the government benchmark for 157 consecutive days. However, the official Treasury curve recorded the two-year par yield at 4.19% on Aug. 7 and 4.25% on Aug. 10.
A matched-date calculation using the Aug. 7 CME settlement bulletin and the 4 p.m. ET New York Bitcoin benchmark of $64,880 produced three gross annualized readings exceeding that day's 4.19% Treasury yield. The December contract registered the lowest of the three at 5.69%. CME Group operates the primary U.S. regulated Bitcoin futures venue, and its settlement data is the standard reference for institutional basis calculations.
Because Aug. 7 falls within the proposed 157-day window, that single observation breaks the streak as calculated from comparable CME and BRRNY inputs. A different venue, tenor, roll rule, or net-cost series could yield another figure; Baumann's thread did not specify those parameters.
How Bitcoin Futures Carry Works
A Bitcoin cash-and-carry position typically combines a spot purchase with a short futures contract. The trader aims to capture the premium of futures over spot as the two prices converge at expiry. The annualized return varies depending on the specific contract and the time remaining to settlement.
CME's BasisWatch methodology uses a 60-second spot time-weighted average from 3:59 p.m. to 4 p.m. ET and the nearest monthly futures contract at 4 p.m., applying a stated roll convention. The matched-date arithmetic applied to the August contract can be extended across the September and December term structure, though the latter two contracts sit beyond BasisWatch's nearest-contract view.
The August contract produced the highest gross annualized basis at 7.89%, followed by September at 6.25% and December at 5.69%.
The Treasury rate serves as a same-date opportunity-cost benchmark. Monthly futures occupy different time horizons, and each trading desk faces its own financing rate. A fully investable calculation must also account for the cost of financing the spot leg, margin requirements, fees, and execution costs on both sides of the trade.
Labeling the strategy "riskless" obscures those cost paths. A Bank for International Settlements study of crypto carry trades found that one-month CME Bitcoin carry exceeded 20% at certain points in 2021, while also documenting financing, leverage, margin, and liquidation risks that could interrupt a position before convergence.
For an arbitrage desk, the relevant Bitcoin futures carry is the net premium remaining after funding, balance-sheet, and execution costs. Even a small net spread can redirect that capital elsewhere, regardless of whether institutions continue accumulating Bitcoin for other strategic reasons.
ETF Inflows and the Carry Connection
U.S. spot Bitcoin ETFs, which received SEC approval in January 2024 and began trading that same month, recorded $853.54 million in net inflows during the week ended Aug. 7, with positive flows in every trading session. While the weekly total captures money entering the products, it cannot reveal how much of that spot exposure was hedged with short futures positions.
A July comparison inadvertently mixed a daily reading with a monthly total. U.S. spot Bitcoin ETFs took in approximately $172 million net during all of July, while July 21 alone contributed roughly $203 million. The cited $205 million figure appears closer to a rounded daily number.
The Commodity Futures Trading Commission's trader categories provide aggregate positions broken down by participant type but do not identify the specific spot or ETF hedge behind any given futures short. CryptoSlate's analysis of ETF and CME market structure describes the recurring carry mechanism in detail. What remains unavailable is trader-level data linking an ETF purchase directly to its corresponding futures leg.
Historical Context and Observable Signals
Baumann's historical parallel spanned August 2022 to January 2023. Bitcoin traded near $15,863 on Nov. 9, 2022 during the FTX collapse, placing the documented price low inside that window rather than at its January endpoint. This chronology provides no basis for treating the conclusion of a low-carry period as a reliable cycle-bottom signal.
Returning cash-and-carry demand should produce three observable traces. First, the futures basis would clear a funding benchmark matched to the contract horizon after costs. Second, ETF net inflows would persist as the spread widened. Third, CME open interest and trader positioning would reflect greater utilization of short futures contracts.
Together, those movements would be consistent with increased arbitrage capital flowing into the market. Nevertheless, ETF and CFTC aggregate data still cannot prove that the same investors hold both legs of the trade, because neither dataset supplies trader-level linkage.
Bitcoin's price can rise on directional buying even when the carry spread remains unattractive. The more informative institutional gauge is the net basis after funding costs, examined alongside ETF flows and CME positioning rather than replaced by any single metric.
Source: CryptoNewsNet

