Bitcoin Price Slides Toward $75,000 as Stock Market Rout Deepens and BTC ETF Outflows Jump
Key Takeaways
- •Spot U.S. Bitcoin ETFs recorded $430.2 million in net outflows, raising November withdrawals to $869.8 million.
- •U.S. equities lost more than $2 trillion, with technology stocks leading the selloff and major Asian indexes also falling sharply.
- •Bullish Bitcoin liquidations exceeded $294 million, the highest level in more than a month, potentially amplifying market volatility.
- •Bitcoin’s daily chart remained in a downtrend, with $70,000 identified as potential support and $77,500 as key resistance.
- •The equity losses and ETF withdrawals coincided with Bitcoin’s decline, but neither factor independently proves what triggered it.
Bitcoin fell toward $75,000 on Nov. 5 as technology stocks led a broad selloff across U.S. equity markets, reversing the cryptocurrency's advance above $80,000 from the previous session. Investing.com data showed an intraday low near $75,241 and a daily close near $76,062. Spot U.S. Bitcoin exchange-traded funds (ETFs) simultaneously recorded $430.2 million in net withdrawals, according to Farside Investors.
The slide came as U.S. stocks erased more than $2 trillion in value, with the S&P 500 surrendering its post-election rally. The moves reinforced concerns about leveraged positions and weakening demand for risk-sensitive assets. That said, neither the equity losses nor the ETF withdrawals on their own establish what triggered Bitcoin's decline: the price faced pressure from both equities and fund flows, without proven causation.
Panic Spreads Across Equity Markets
BTC dropped sharply as investors reacted to the equity rout. The S&P 500 Index fell 335 points on Thursday, while the Nasdaq 100 and Dow Jones retreated 1,421 and 1,833 points, respectively. The VIX Index, a measure of expected market volatility, jumped 11% to 28, its highest level in months.
Selling pressure was concentrated in technology. Nvidia tumbled nearly 10%, while Micron, SanDisk, SpaceX and Tesla declined by double digits. In total, the U.S. stock market lost over $2 trillion during the rout. The selloff extended into Asia, where the Hang Seng, Kospi Index and Nikkei 225 each plunged more than 5%.
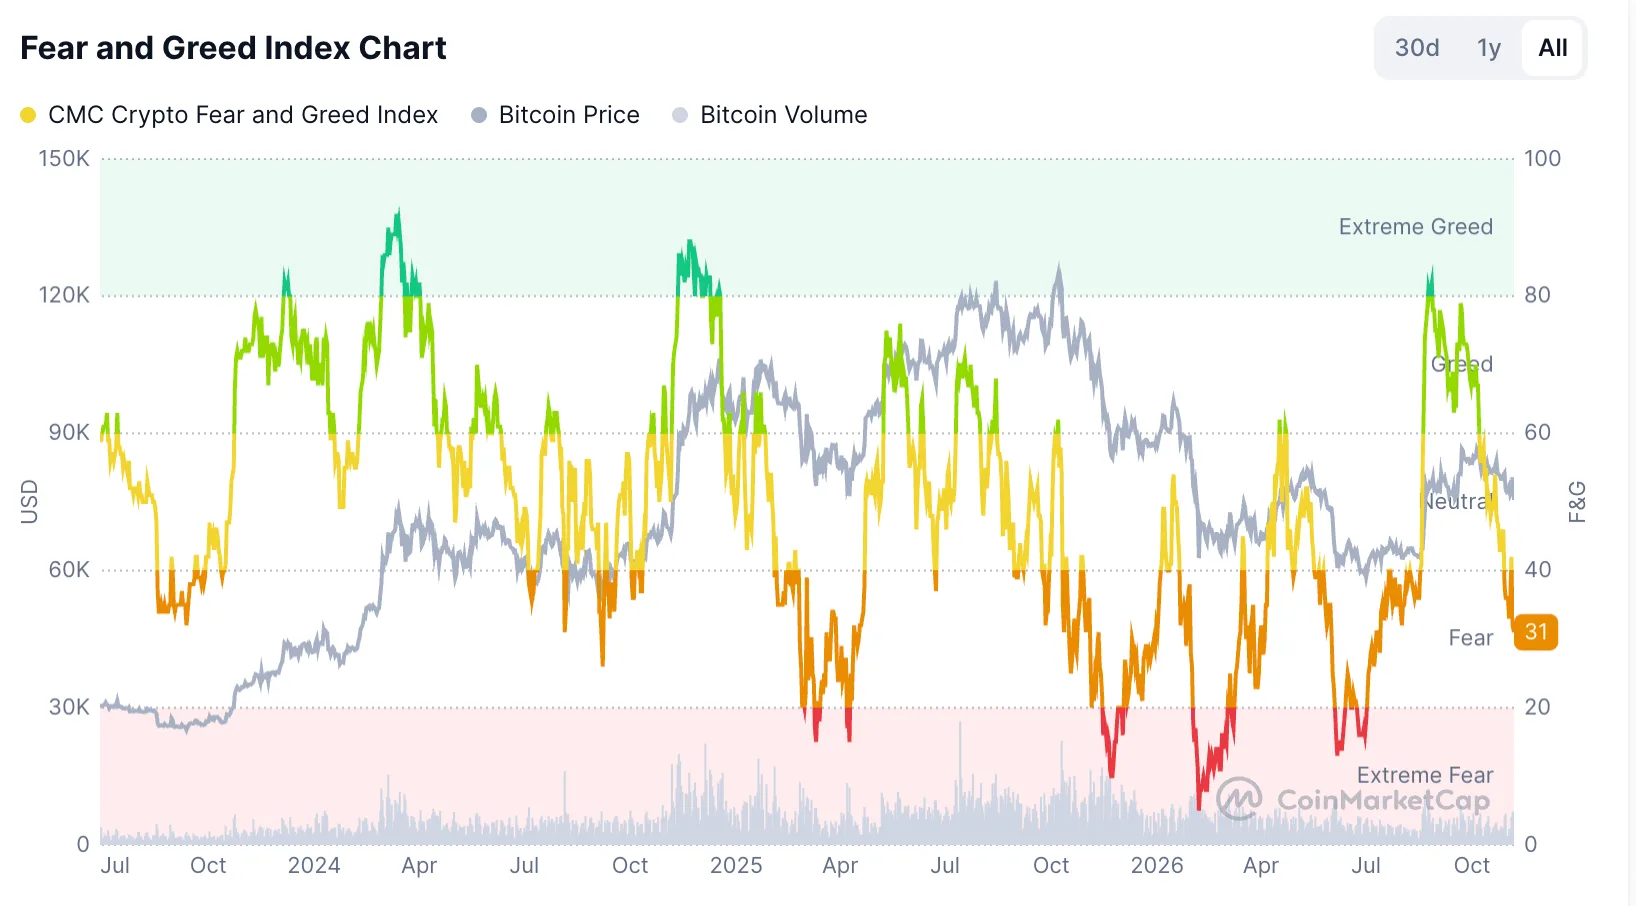
Bitcoin and other risk assets commonly fall when equities are in freefall, though a closer look shows the cryptocurrency's weakness was milder than the damage in stocks. Its retreat also coincided with a drop in the Crypto Fear and Greed Index to 31, deep within the fear zone, down from a reading of 81 in greed territory a few months ago. BTC has historically underperformed when market sentiment turns fearful.
ETF Outflows and Liquidations Climb
The price retreat coincided with accelerating outflows from the ETF market. Spot Bitcoin ETFs shed more than $430 million on Thursday, lifting November's cumulative withdrawals to $869.8 million across four sessions, after $515 million in outflows the previous month.
Earlier in the year, the funds posted stronger results, adding over $2.65 billion in September following inflows of $3.52 billion in August and $172 million in July. In aggregate, the funds now hold more than $96 billion in assets, with cumulative net inflows of $56 billion. Because these funds trade on U.S. exchanges and publish their flows daily, the Farside Investors figures function as a closely followed gauge of American demand for bitcoin exposure — which is why November's reversal has drawn attention alongside the equity rout.
Liquidation activity also surged as the selloff intensified. Bullish liquidations exceeded $294 million on Thursday, the highest level in more than a month. Liquidations are forced closures of leveraged positions that occur when a price move leaves traders' collateral insufficient to cover losses, a mechanism that tends to amplify swings during sharp selloffs. BTC has often underperformed when bullish liquidations are rising.
Debt Fears and the Safe-Haven Case
On the positive side, Bitcoin's decline was smaller than that of several blue-chip names, including Nvidia and Micron. Robert Kiyosaki, author of “Rich Dad, Poor Dad,” argued that Bitcoin will do well because of rising U.S. public debt, which climbed to $40 trillion a few months ago and has since crossed the $40.5 trillion mark. Bitcoin is frequently viewed as a safe-haven asset because its supply is capped at 21 million coins.
Technical Analysis: Key Levels in Focus
The daily chart shows BTC in a slow downtrend over recent weeks. The price has slumped to around $75,000, falling below the 38.2% Fibonacci retracement level, and remains capped by the 50-day exponential moving average (EMA) and the Supertrend indicator, while the Relative Strength Index (RSI) continues to decline.
Based on these signals, the analysis points to a likelihood of further downside, potentially toward the crucial support level at $70,000. Conversely, a move above the key resistance at $77,500 could open the way for additional gains toward the psychological level of $80,000. For readers following the sessions ahead, the daily ETF flow reports from Farside Investors, read alongside these chart levels, provide the most direct markers of whether November's outflow streak and the downtrend persist or ease.
Source: The Market Periodical

