Bitcoin Falls Below $69,000 to Three-Month Low as It Tests the 200-Week Moving Average
Key Takeaways
- •Bitcoin dropped below $69,000 to its lowest level in three months after losing more than 7% over two days, while total crypto market capitalization fell over 9% during the past week.
- •U.S. spot Bitcoin ETFs have seen $1.88 billion in outflows this month, with net withdrawals on seven of eight November trading days and total net assets declining from $102.26 billion to $93.70 billion.
- •Bitcoin's slide has moved in step with the AI stock selloff, which intensified after Nvidia's board announced Jensen Huang's resignation as CEO on November 12.
- •Core CPI rose 0.3%, above the 0.2% forecast, prompting Fed Governor Christopher Waller to put a half-point rate hike on the table ahead of the December 8-9 meeting as Treasury yields pushed above 5%.
- •Bitcoin is trading just above its 200-week moving average near $67,990, a level that marked cycle bottoms in 2015, 2018-19 and 2020 but was breached for months in 2022.
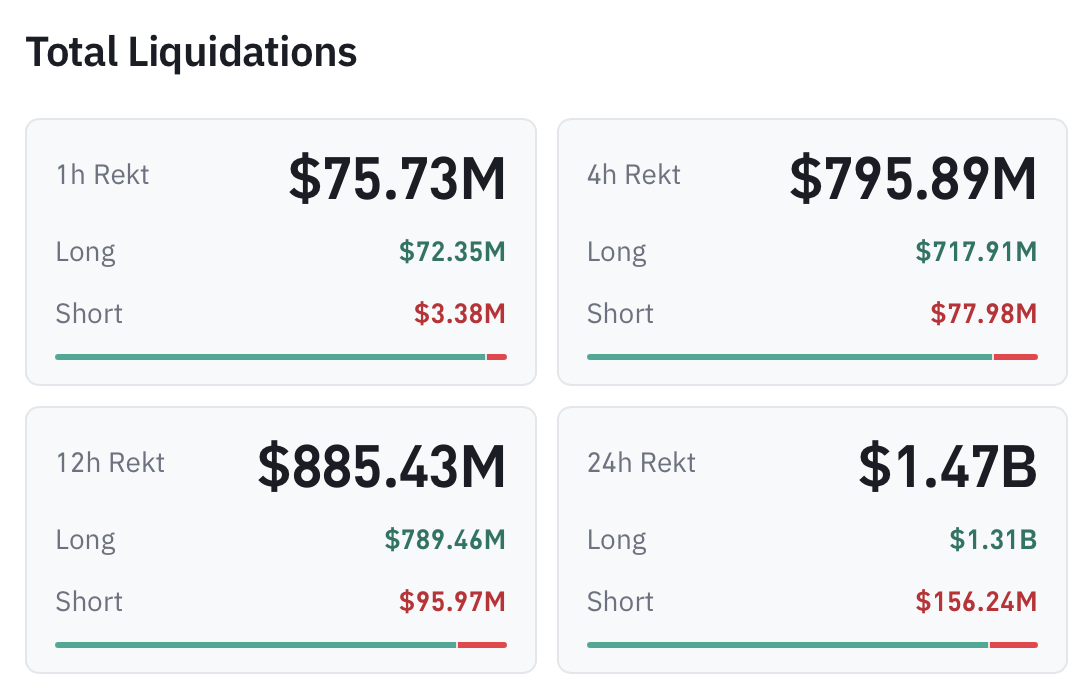
Bitcoin has slipped below $69,000, hitting its lowest level in three months after a selloff that erased more than 7% of its value over the past two days. The downturn has spread across the broader crypto market, with total market capitalization down more than 9% over the past week. Coinglass data shows 24-hour long liquidations across crypto have reached $1.31 billion. Liquidations are the forced closure of leveraged long positions by exchanges once margin requirements can no longer be met, and the cascading forced sales that follow can amplify a downturn as it unfolds.
Trading Well Below the Bull Market Support Band
Bitcoin's bull market support band is a weekly-chart indicator made up of two lines: the 20-week simple moving average and the 21-week exponential moving average. Traders and technical analysts watch the gap between them closely. In bullish uptrends, Bitcoin tends to hold above the band or use it as support during pullbacks; when price breaks below it, the prevailing momentum or trend has usually lost its footing.
BTC tested the band as support in early November, but has since fallen well below the range after an accelerated selloff. The band now sits between $73,570 and $76,530, and traders are expected to watch that area closely as overhead resistance if BTC stages a recovery rally.
ETF Outflows Accelerate Through November
Outflows from Bitcoin ETFs have reached -$1.88 billion so far this month, according to data from SoSoValue. U.S. spot Bitcoin ETFs have posted net outflows on seven of the eight trading days so far in November, and the pace has accelerated over the past few sessions. Roughly $1.44 billion left the funds over the last five sessions, including $299.9 million on November 11. Total net assets fell from $102.26 billion on Nov. 4 to $93.70 billion.
Because the funds hold bitcoin directly and buy or sell the asset to match shareholder flows, their daily prints have become one of the most closely tracked gauges of institutional demand since the products launched in January 2024.
The AI Sell-off Is Dragging Bitcoin Along
The heaviest single-day outflow of the month came on November 5, when $430.2 million exited the ETFs. In the same session, the Nasdaq dropped 5.52%, its worst day since April 2025, Nvidia lost about 9%, and Bitcoin slid below $76,000.
Bitcoin has traded in step with AI-heavy tech stocks for most of 2026, and miners form a significant part of that link, since many have sold BTC to fund AI data center buildouts. That buildout push has turned a growing roster of listed miners into hybrids of energy operators and AI infrastructure providers, deepening the overlap between the two trades. On November 12, Nvidia's board announced that Jensen Huang had resigned as CEO, effective immediately. The news landed on a sector that was already bleeding, and the risk-off mood carried straight into crypto.
Hot Inflation Brings a December Hike Into Play
Core CPI rose 0.3%, ahead of the 0.2% forecast. The core measure strips out volatile food and energy prices, offering a steadier read on underlying inflation trends. Fed Governor Christopher Waller responded by putting a half-point hike on the table, and Treasury yields pushed above 5%. A sitting governor's public remarks do not set policy on their own, but traders parse them for signals about where the debate inside the Fed is heading. Higher yields make a non-yielding asset like bitcoin harder to hold, and traders have started pricing in that risk ahead of the Fed's Dec. 8-9 meeting.
All Eyes Are on the 200-Week Moving Average
BTC is now trading just above its 200-week simple moving average, which sits near $67,990. Few long-term levels carry as much weight for bitcoin. The 200-week MA marked zones near the bottom of the 2015, 2018-19 and 2020 cycles, and bitcoin bounced off it earlier this year. Long-term buyers have often treated a visit to the line as an entry point.
The level has failed before. In 2022, bitcoin spent months trading below the 200-week MA before it found a bottom. Because the line is built from weekly closing prices, a break or a reclaim of it only registers once the week is done. A weekly close above the line would keep long-term support intact, while a clean break below it would bring a deeper correction into view, with the December Fed meeting less than four weeks away.

