Bitcoin slips below $86,000 as ETF outflows cap recovery efforts
Key Takeaways
- •Bitcoin has advanced for three consecutive weeks, gaining more than 12% since mid-September, yet prices remain well below the October 2025 record high of $126,199.
- •U.S. spot bitcoin ETFs posted $241.09 million in net inflows last week, a third straight week of positive flows, but recorded a $90 million outflow on Monday.
- •September nonfarm payrolls rose by 29,000, well short of the expected 90,000 increase, and August's gain was revised down to 133,000 from 162,000.
- •Following the employment report, CME FedWatch put the probability of an October Federal Reserve rate hike at 18.3% on Monday, down from roughly 70% the previous week.
- •Bitcoin's weekly chart shows initial resistance at $87,599, with a close above that level bringing the 100-week simple moving average near $89,832 and the $90,000 threshold into focus.
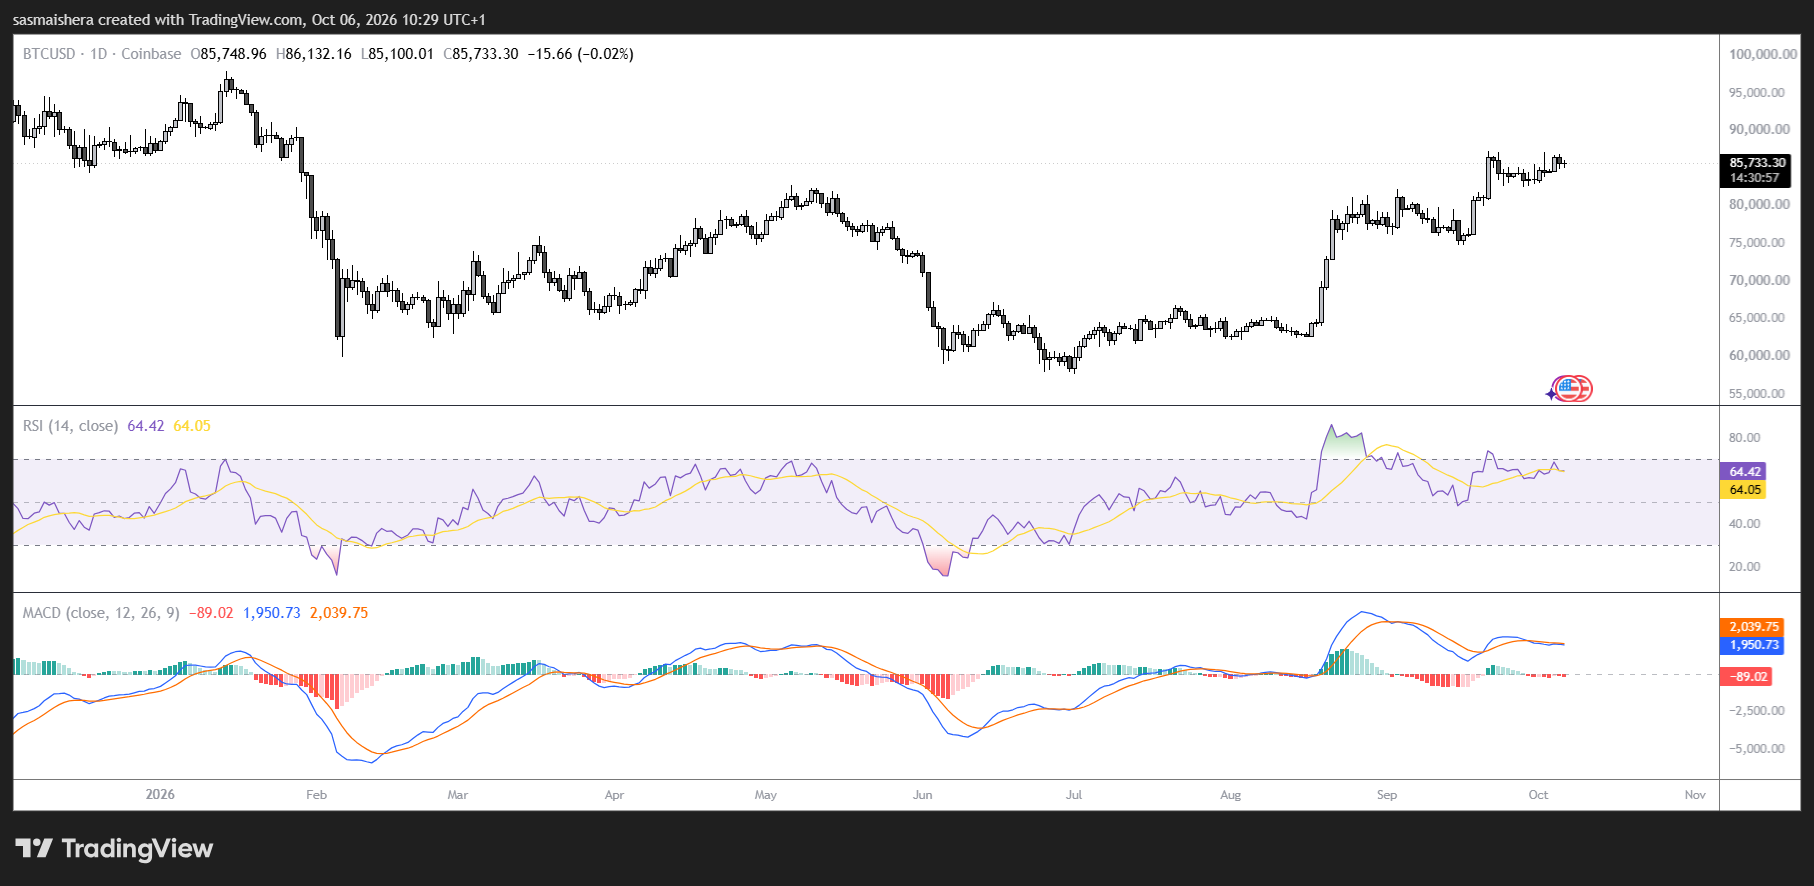
Bitcoin traded below $86,000 on Tuesday, consolidating a recovery of more than 12% since mid-September after three consecutive weekly gains. U.S. spot bitcoin exchange-traded funds posted a $90 million outflow on Monday, tempering momentum after last week's $241.09 million in net inflows.
Three weeks of gains meet overhead resistance
The largest cryptocurrency has advanced for three straight weeks, supported by steady ETF demand and shifting expectations around Federal Reserve policy. The rally has carried prices toward a technical zone that could determine whether buyers extend the move toward $90,000. Even after the rebound, prices remain well below the October 2025 record high of $126,199.
Bitcoin's technical structure remains constructive on both daily and weekly charts, although several daily momentum readings have moderated, suggesting consolidation near recent highs rather than an uninterrupted climb. Holding the nearby $85,000 support would help preserve that bullish structure, while a break below it would raise the possibility of a deeper correction.
U.S. spot bitcoin ETFs, which hold bitcoin directly, recorded $241.09 million in net inflows last week, according to SoSoValue data, marking a third consecutive week of positive flows and showing that demand through the products continued alongside bitcoin's price recovery. The week nonetheless began on a weak note, with the funds recording a $90 million outflow on Monday.
Repeated inflows provide a supportive backdrop, though they do not guarantee further gains. Their significance will depend on whether buying persists and how it compares with selling elsewhere in the market. An acceleration in flows would strengthen the demand picture as bitcoin approaches overhead resistance, while weaker flows could leave the recovery more dependent on other buyers. For now, ETF activity remains one of the factors supporting the recent advance.
Weak payrolls pull back October rate hike odds
Investors also scaled back expectations for another Federal Reserve rate increase after Friday's weaker-than-expected U.S. employment report. September nonfarm payrolls rose by 29,000, according to the Bureau of Labor Statistics, falling short of the expected 90,000 increase, while August's gain was revised down to 133,000 from 162,000.
Following the report, CME FedWatch placed the probability of an October rate hike at 18.3% on Monday, down from roughly 70% the previous week. Reduced expectations for tightening can support risk assets by easing concerns about more restrictive financial conditions, although lower hike odds are not a promise of easier policy. They reflect market pricing that can change as additional economic data becomes available.
Weekly resistance stands between bitcoin and $90,000
On the weekly chart, bitcoin faces initial resistance at $87,599, the 50% retracement of the move between the August 2024 low of $49,000 and the October 2025 record high of $126,199. A weekly close above that level would bring the 100-week simple moving average at approximately $89,832 into focus, followed by the psychological $90,000 threshold.
Weekly momentum supports the recovery: the Relative Strength Index is around 62 and rising, while the Moving Average Convergence Divergence shows expanding positive histogram bars. If resistance holds and a broader correction develops, the cited downside references include the $78,490 Fibonacci level and the 50-day simple moving average near $77,201.
The daily chart shows bitcoin trading above its 50-day, 100-day, and 200-day exponential moving averages, reinforcing the near-term bullish bias. The daily RSI stands near 67, indicating strong momentum just below conventional overbought territory, while the MACD histogram has eased toward zero, suggesting upward pressure is slowing.
Immediate support lies at $85,000. A daily close below that floor would weaken the consolidation structure and expose the 50-day EMA near $79,189. Further below, the 100-day EMA at $75,367 and the 200-day EMA near $74,994 form a deeper support area, with more distant horizontal levels at $66,500 and $62,300.
Bitcoin's recovery remains intact, but clearing $87,599 would provide stronger confirmation that buyers can carry the move toward $90,000.

