Bitcoin, Ethereum and XRP Flash TD Sequential Buy Signals After Sharp Sell-Off
Key Takeaways
- •Bitcoin, Ethereum, and XRP each flashed a four-hour TD Sequential buy signal after a market-wide pullback, suggesting the selling may be approaching exhaustion.
- •Bitcoin fell 5.55% from $86,976 to about $82,150, Ethereum dropped 7.36% from $2,738 to $2,537, and XRP declined from $1.53 to $1.39 before the signals appeared.
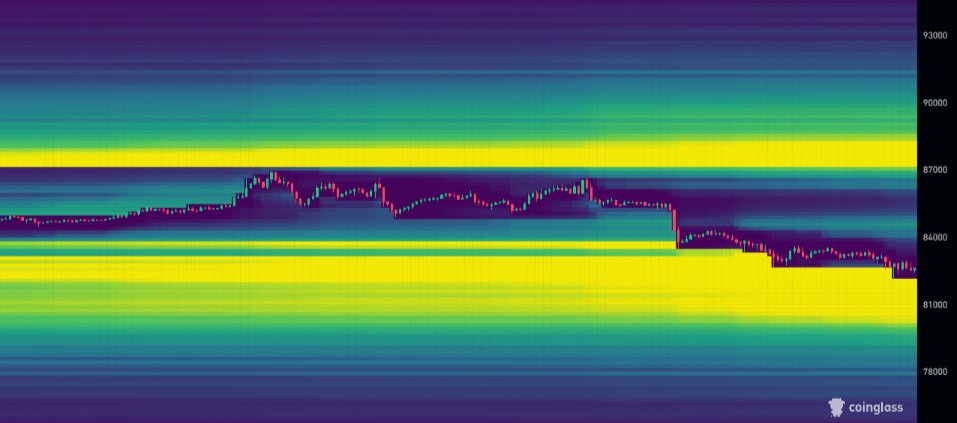
- •Market expert Gerla identified a long-liquidation pool near Bitcoin's price and expects a possible final flush toward $80,500–$82,000, with $82,500 as the key reclaim level and $87,000 as an upside target.
- •Ethereum is sitting on major support near $2,550, where elevated open interest and negative funding indicate leverage is building and a sharp move could follow in either direction.
- •The buy signals do not confirm a market bottom, and traders are watching Bitcoin's $82,500 level, Ethereum's $2,550 support, and XRP's trendline to gauge buyer strength.
Bitcoin, Ethereum and XRP have each flashed four-hour TD Sequential buy signals following a sharp market-wide pullback, and analysts are now watching whether buyers can turn those technical setups into a rebound.
Bitcoin fell 5.55% from $86,976 on October 5 to $82,150, while Ethereum dropped 7.36% from $2,738 to $2,537. XRP also declined from $1.53 to $1.39 before its four-hour buy signal appeared. Data from CoinGecko, a cryptocurrency price aggregator, shows all three assets remain under pressure across daily and weekly timeframes, though market participants are monitoring key support levels for signs that buyers could return.
The TD Sequential indicator, developed by market technician Thomas DeMark, counts consecutive candles to flag potential points of trend exhaustion. Its signals typically require confirmation from price action at nearby support levels — which is why each of the setups below comes with a specific level traders are monitoring.
Bitcoin Buy Signal Emerges Near Key Liquidity Zone
Analyst Ali Charts said Bitcoin's four-hour TD Sequential has flashed a buy signal following the latest correction. The indicator appeared after BTC dropped 5.55% from its October 5 high.
BUY SIGNAL ON BITCOIN, ETHEREUM, AND XRP 1/5 🧵👇 — Ali Charts (@alicharts) October 8, 2026
CoinGecko data at the time of writing places Bitcoin at $82,272.09, down 1.26% over 24 hours. BTC has declined 1.96% over the past seven days, with daily volume at $33.78 billion.
The signal suggests the pullback could be approaching exhaustion. However, the indicator alone does not confirm that Bitcoin has formed a local bottom.
Market expert Gerla also identified a major long-liquidation pool around Bitcoin's price — a concentration of leveraged long positions that can be force-closed if price falls into the zone. Gerla expects a possible final flush toward $80,500–$82,000 before any recovery. The analyst is watching $82,500 as the key reclaim level, with $87,000 as a potential upside target. A move into liquid-heavy areas could force leveraged positions to close before a rebound develops.
Could Ethereum Buy Signal Trigger a Recovery?
Ethereum has produced a similar four-hour TD Sequential buy signal after its 7.36% decline. Ali Charts is watching $2,620 and $2,650 if buyers confirm the setup.
CoinGecko data shows ETH at $2,528.90, down 1.45% over 24 hours. Ethereum has fallen 6.56% over seven days, while daily trading volume stands at $14.37 billion.
Analyst Mister Crypto identified $2,550 as major support for Ethereum and pointed to elevated open interest and negative funding on some exchanges.
$ETH is sitting on MAJOR support around $2,550. Ethereum open interest is near its highest level in weeks, while funding has turned negative on some exchanges. Leverage is building right at support. A BIG move could be coming. pic.twitter.com/4BXMfRo9JB — Mister Crypto (@misterrcrypto) October 8, 2026
Open interest measures the value of outstanding derivatives positions. Negative funding can indicate that short positions are paying long positions to maintain leveraged trades.
Mister Crypto warned that leverage is building around the support area, a combination that could produce a sharp move if ETH either holds support or breaks below it.
XRP Buy Signal Tests a Key Trendline Support
XRP has also flashed a four-hour TD Sequential buy signal after falling from $1.53 to $1.39. Ali Charts questioned whether the signal could mark a local low.
At publication, CoinGecko shows XRP at $1.39, down 2.81% over 24 hours. The token has declined 6.56% over seven days, with daily volume reaching $2.36 billion.
Analyst Wealthmanager said XRP is testing key trendline support on the four-hour chart and described the MACD — the Moving Average Convergence Divergence, a momentum indicator — as deeply oversold. An oversold MACD can indicate that recent selling pressure has become extended. However, it does not guarantee an immediate reversal or sustained price recovery.
What Traders Are Watching Next
Taken together, the three buy signals point to possible rebounds after the recent selling, but they do not confirm a bottom. Traders will now watch Bitcoin's $82,500 reclaim level, Ethereum's $2,550 support, and XRP's trendline for signs of buyer strength.
If those levels hold, the signals could gain weight. If they fail, selling pressure may remain in control.

