Bitcoin, Ethereum, XRP: Key Price Levels to Watch Ahead of US Inflation Report
Key Takeaways
- •Bitcoin changed hands near $83,450 on Oct. 12 ahead of the U.S. September CPI release scheduled for Oct. 14, which could shape expectations for the Federal Reserve's next interest rate decision.
- •Crude oil surged on geopolitical supply concerns, with Brent rising to $107 and WTI to $94, and economists expect the inflation report to show a September jump in both headline and core CPI.
- •Bitcoin's technical setup remains bullish, with a golden cross and a completed break-and-retest pattern pointing to a potential breakout above $87,200 that could open the path toward $100,000.
- •Ethereum retreated from its September high of $2,806 to about $2,530 amid continued ETH ETF outflows, and analysts see a possible decline toward $2,300 unless resistance at $2,600 is reclaimed.
- •XRP fell to $1.3765 after forming a double-top at $1.6555, and a break below the $1.2522 neckline support could extend the decline toward $1.
Bitcoin (BTC) traded near $83,000 on Oct. 12 as the cryptocurrency market faced renewed uncertainty ahead of a closely watched U.S. inflation report, with Ethereum (ETH) and XRP also remaining under selling pressure.
Barron's reported Bitcoin changing hands near $83,450 during Monday's session, reflecting limited movement ahead of this week's economic releases. Crude oil prices climbed in parallel, as geopolitical tensions raised concerns about global energy supplies.
Investors now await September's Consumer Price Index (CPI), scheduled for release on Wednesday, Oct. 14. The report could shape expectations for the Federal Reserve's upcoming interest rate decision. Against that backdrop, The Market Periodical's technical analysis laid out the following outlook for the three major tokens.
Inflation Data in Focus
The upcoming U.S. consumer inflation data stands as the main catalyst for the crypto market this week. The CPI tracks the average change in prices consumers pay for a basket of goods and services, and it is one of the primary gauges the Federal Reserve consults when weighing its policy path, which is why the release routinely ranks among the most market-moving data points on the economic calendar. Economists expect the report to show that both headline and core inflation jumped in September as energy prices soared, and higher crude oil prices will likely keep inflation elevated through this month.
Brent, the global benchmark, rose to $107 on Monday, while West Texas Intermediate (WTI) moved to $94. Both benchmarks have soared by more than 50% from their July lows.
Rising oil prices are seen as a headwind for risk assets because of their impact on inflation. Higher inflation may prompt the Federal Reserve to hike interest rates, and in most cases Bitcoin and other risky assets tend to underperform whenever the Fed is in a rate-hiking cycle.
Bitcoin Price Prediction
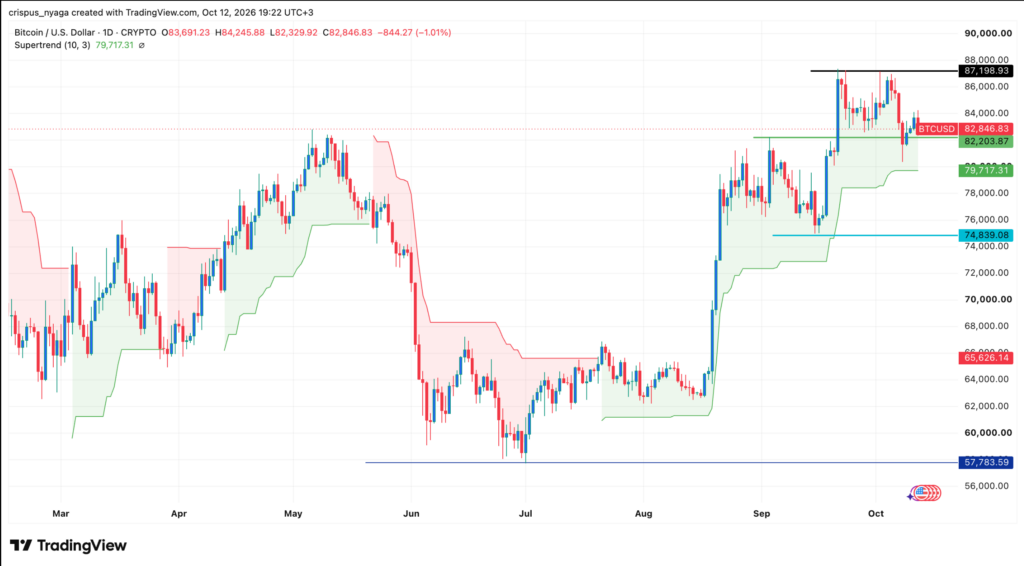
Bitcoin's daily chart points to encouraging technicals. The asset has been in an uptrend after bottoming at $57,783 in July and has reached a high of $87,200 this month. It also formed a golden cross, a bullish pattern that occurs when the 50-day and 200-day moving averages cross each other. Levels such as the $87,200 high draw attention from traders because prior highs and support zones often attract clusters of buy and sell orders.
Bitcoin jumped above the key resistance level of $82,200 on Sept. 21 as the bull run accelerated, but it peaked at $87,200 and began to decline. The coin has since completed the formation of a break-and-retest pattern, which often leads to a continuation of the prior trend.
The asset has remained steady above the Supertrend indicator, a commonly watched bullish signal. According to the analysis, the most likely scenario is that Bitcoin continues rising as bulls target the key resistance at $87,200. A surge above that level would point to further gains toward $100,000.
Ethereum Price Prediction
Ethereum has also come under pressure in recent weeks, retreating from a September high of $2,806 to current level of about $2,530. The pullback coincided with continued outflows from ETH ETFs, a flow metric closely tracked as a gauge of institutional participation in the Ether market.
A closer look at the chart shows the coin dropped and retested the key support level of $2,461, its April high. After a sharp decline on Oct. 8, ETH crawled back to a high of $2,572 before pulling back to around $2,530.
The token has moved below both the Supertrend indicator and the 25-day EMA, a short-term trend gauge. According to the analysis, it will likely resume its downward trend, potentially targeting the important support level of $2,300. A move above the resistance level of $2,600 would invalidate the bearish outlook.
XRP Price Prediction
XRP has slumped substantially from its September high to its current level of $1.3765. The token formed a double-top pattern at $1.6555 with a neckline at $1.2522, a formation that often precedes a bearish reversal.
XRP has dropped below its 50-day EMA and is trading on the lower side of the Bollinger Bands, a volatility gauge that frames a token's recent trading range. Meanwhile, the Relative Strength Index (RSI), a momentum indicator whose neutral midpoint sits at 50, has trended steadily lower and moved below the neutral level.
Per the analysis, the token will likely continue falling, potentially to the key support level of $1.2522. A move below that level would point to more downside, potentially to $1.
Attention now shifts to Wednesday's CPI release and the direction of oil prices as the key near-term drivers for the crypto market.
This article is for informational purposes only and does not constitute financial or investment advice. It was originally published by The Market Periodical.

