Crypto ETF Flows Split as Bitcoin Funds Gain $305 Million and Ethereum Funds Lose $221 Million
Key Takeaways
- •US spot Bitcoin ETFs attracted $304.73 million in net inflows during the week ending Oct. 23, 2026, ending two consecutive weeks of withdrawals that totaled roughly $909 million.
- •Ethereum ETFs extended their losing streak to a fourth week with a $220.60 million outflow, bringing total withdrawals since Sep. 25 to approximately $1.23 billion.
- •Bitcoin ETF cumulative net inflows rose to $57.32 billion, with total net assets increasing to $104.71 billion from $104.29 billion the prior week.
- •Ethereum ETF net assets fell about 18% to $14.57 billion from $17.78 billion, driven by both outflows and a lower ETH price, while weekly trading volume slipped to $2.37 billion.
- •Bitcoin traded near $80,435 with a weekly RSI of 54.55, holding above the $78,000-$80,000 support zone but facing resistance at the $85,000-$88,000 band, while ETH sat near $2,330 with a weekly RSI of 43.04.
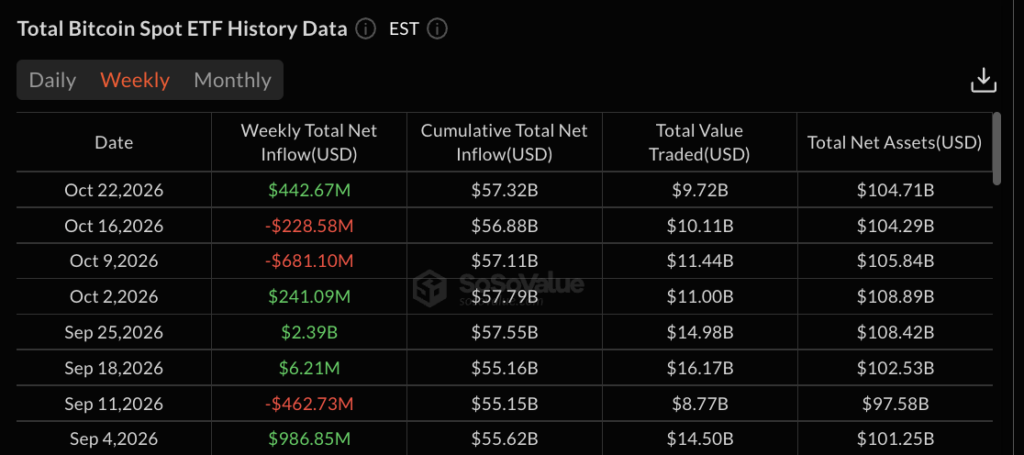
US spot Bitcoin exchange-traded funds (ETFs) drew $304.73 million in net inflows during the week ending Oct. 23, 2026, while Ethereum ETFs lost $220.60 million, according to SoSoValue data.
Weekly tallies like these are followed closely because spot ETFs hold the underlying tokens and trade through brokerage accounts, making their flows a running gauge of how fund money is positioned in the two largest cryptocurrencies.
The readings split the crypto ETF market in two. Bitcoin funds reversed two consecutive weeks of withdrawals, while Ethereum funds extended their losing streak to a fourth week — a decline that came despite a modest inflow on Friday. Cryptocurrency prices stayed under pressure through the period, with Bitcoin trading near $80,435 and Ethereum hovering around $2,330 as traders weighed the potential for further downside.
Bitcoin ETFs Reverse Two Weeks of Outflows
A weekly figure dated Oct. 22 showed Bitcoin ETFs gaining $443 million, lifting cumulative net inflows for the products to $57.32 billion. Total net assets rose to $104.71 billion from $104.29 billion the week before. Cumulative net inflows measure the running total of money added since the funds launched, net of withdrawals, while the net asset total also moves with Bitcoin's price.
The gain followed two difficult stretches. Bitcoin ETFs lost $681.10 million in the week dated Oct. 9 and another $228.58 million in the week dated Oct. 16. Last week's rebound recovered roughly half of those combined losses in a single week.
Ethereum ETFs Extend Losing Streak to Four Weeks
Ethereum funds remain in a weaker position. A $224.96 million outflow pushed cumulative net inflows down to $12.71 billion from $13.94 billion in late September. Across the four weeks since Sep. 25, Ethereum ETFs have shed approximately $1.23 billion.
Total net assets fell from $17.78 billion to $14.57 billion over the same span, a decline of about 18% driven by outflows and a lower ETH price. Because net asset values track the token's market price as well as fund flows, the asset decline runs well ahead of the $1.23 billion in withdrawals alone. Weekly trading volume also slipped to $2.37 billion.
For crypto ETFs as a group, the picture is less bleak than Ethereum's numbers alone suggest. Combined, the two products still posted net inflows of about $218 million, but nearly all of the fresh capital flowed to Bitcoin.
Bitcoin Price Analysis: Can BTC Build on Strong Weekly Inflows?
Bitcoin trades near $80,435 on the weekly chart after pulling back from the $85,000 to $88,000 area. The recovery from the early-2026 lows near $60,000 to $65,000 remains intact, but sellers have stepped in each time BTC approached that resistance band.
The weekly relative strength index (RSI), a momentum indicator scaled from 0 to 100, sits at 54.55, just above the neutral 50 line. Buyers hold a slight edge, though the reading is far from overbought, pointing to a recovery that is losing some momentum. Open interest — the total number of outstanding derivative contracts — has stayed broadly flat, with no sign of a fresh wave of leveraged bets.
The first support zone sits at $78,000 to $80,000. A weekly close below it could send BTC toward $72,000 to $75,000.
Ethereum Price Analysis: Can ETH Recover Amid Persistent Outflows?
Ethereum looks weaker. ETH trades near $2,330 after slipping from recovery highs around $2,700 to $2,800 and now sits below the $2,500 area that capped earlier bounces.
The weekly RSI reads 43.04, below the neutral line, giving sellers a modest advantage. The indicator is not deep enough in oversold territory to suggest a rebound is close.
Immediate support sits at $2,250 to $2,300. Losing that zone would put $2,000 to $2,100 in play. On the upside, ETH needs to reclaim $2,450 to $2,550 before a retest of $2,700 to $2,850 becomes realistic.
Ethereum remains the weak spot among crypto ETFs. With fund investors pulling money for four consecutive weeks, ETH lacks the steady buying support that Bitcoin received last week.
Outlook: Will the Inflows Become a Streak?
The next move for BTC depends on whether last week's inflows develop into a sustained run. One positive week after two negative ones is encouraging, but it does not yet constitute a trend. Bitcoin ETFs saw a similar pattern in September, when a $2.39 billion inflow week was followed by outflows two weeks later.
If crypto ETFs keep adding Bitcoin exposure and BTC holds above $78,000, buyers could take another run at the $85,000 to $88,000 band. A weekly close above that area would open the path toward $90,000 to $95,000, the broader resistance zone on the chart.
The bearish case is just as clear. A break below $78,000 would weaken the recovery structure and bring $72,000 to $75,000 back into view.
Disclaimer: This article provides information, not financial advice. Cryptocurrency investments carry substantial volatility and the potential for losses. Readers should conduct independent research before investing.
This article first appeared on The Market Periodical.

