Bitcoin ETFs Lose $1.58 Billion as BTC Price Risks Sixth Weekly Decline
Key Takeaways
- •Bitcoin ETFs recorded $95 million in net outflows on November 10, marking a fourth consecutive day of withdrawals and bringing the four-session total to roughly $1.14 billion.
- •Weekly outflows have been substantial, including $1.28 billion in the week ending November 6, with net withdrawals since November 2 totaling about $1.58 billion.
- •Bitcoin has declined from the $81,900 area to trade near $74,266, putting the asset at risk of a sixth consecutive weekly decline.
- •Bitcoin ETF net assets fell to $92.82 billion from $102.26 billion on November 4, driven by redemptions and the lower price of Bitcoin.
- •Spot Ethereum ETFs posted $1.32 million in net outflows on November 10, their fourth straight day of withdrawals, leaving net assets at $11.64 billion.
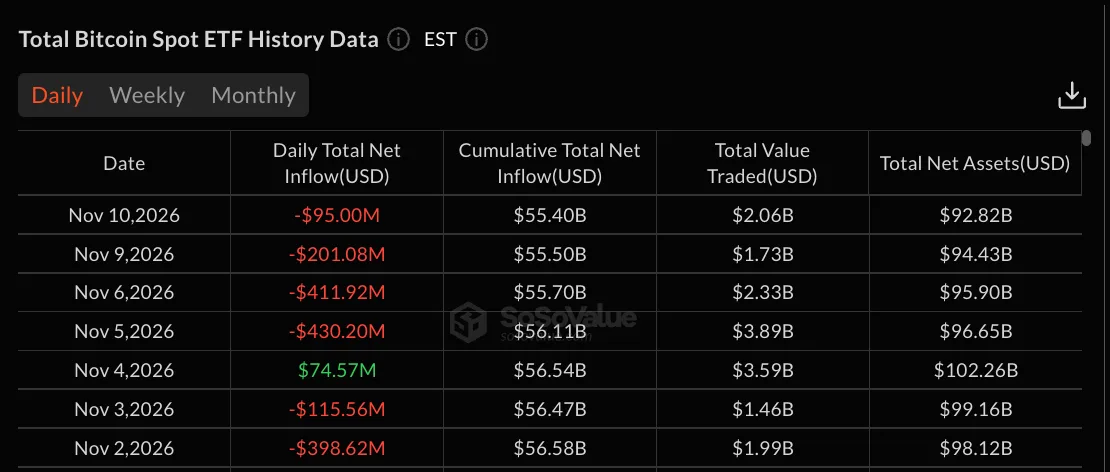
Bitcoin exchange-traded funds posted another day of net outflows on November 10, extending their withdrawal streak to a fourth consecutive session as the price of Bitcoin struggled to hold above $74,000 and risked a sixth consecutive weekly decline. Data from SoSoValue shows the funds lost $95 million on the day, taking cumulative outflows over the four sessions to roughly $1.14 billion.
Spot Bitcoin ETFs, which began trading on U.S. exchanges in January 2024 and hold Bitcoin directly, have made their daily flow tallies a closely tracked gauge of stock-market demand for the asset. The funds issue new shares when money arrives and retire shares when investors redeem, so a run of outflow days means withdrawals outpaced new purchases across the product group.
Four-Day Outflow Streak Deepens
The current run began on November 5, when Bitcoin ETFs recorded $430.20 million in net outflows. Another $411.92 million left the funds the following day, followed by $201.08 million on November 9 and $95 million on November 10. The selling pressure has tracked the price of Bitcoin lower throughout the period.
The weekly picture is heavier still. Bitcoin ETFs lost $1.28 billion in the week ending November 6, on top of $202.59 million in outflows the week before. The current week has already seen $296.08 million exit the funds. Since November 2, net withdrawals from the products total about $1.58 billion, with only November 4 breaking the pattern through a modest $74.57 million inflow.
Trading Activity Rises as Net Assets Fall
The November 10 outflow was the smallest of the four sessions, and trading activity picked up. Total value traded across Bitcoin ETFs reached $2.06 billion, up from $1.73 billion a day earlier.
Total net assets fell to $92.82 billion, down from $102.26 billion on November 4. Part of the decline stems from fund redemptions and part from the falling price of Bitcoin itself.
Ether funds are moving in the same direction. Spot Ethereum ETFs posted $1.32 million in net outflows on November 10, their fourth straight day of withdrawals — a small figure, but one that followed a $184.51 million outflow on November 9. Ethereum ETF net assets now stand at $11.64 billion, down from $14.12 billion on November 4, while cumulative net inflows for Ether products have eased to $11.74 billion from $12.15 billion as of November 2. The Ether fund complex, which launched on U.S. exchanges in July 2024, remains far smaller than its Bitcoin counterpart — its $11.64 billion in net assets is roughly one-eighth of the Bitcoin funds' $92.82 billion.
BTC Price Stuck Below Key Resistance
On the 1-hour chart, BTC is trading near $74,266 after bouncing from a recent low around $72,727. The bounce offers bulls some relief, but the broader structure still leans bearish to neutral. Bitcoin has fallen from the $81,900 area and has printed lower highs since the sell-off of November 5 and 6.
Immediate support sits between $73,000 and $72,700, with the recent swing low at $72,727. A clean break below that zone would open the door to $72,000 and possibly another leg lower. On the upside, BTC faces initial resistance at $74,500 to $75,000, followed by a stronger barrier between $75,500 and $76,000, where price consolidated earlier. If buyers clear $76,000, the next target lies at $77,000 to $77,500.
Technical indicators are mixed. The relative strength index sits around 51, a neutral reading: it has climbed out of oversold territory but has yet to reach the 60 level that would point to genuine buying strength. MACD has turned slightly positive and its histogram is improving, though the signal remains weak and needs confirmation from a move above resistance.
Volume and Positioning Point to a Fragile Bounce
Trading volume rose during the drop toward $72,727, while the subsequent recovery has come on lighter volume — a gap that suggests the bounce carries little conviction. Open interest stayed elevated through much of the move but has begun to ease, indicating traders are closing positions rather than piling into new futures bets.
The level to watch is $75,000. A 1-hour close above $75,000 to $75,500, followed by a break of $76,000, would strengthen the recovery and could carry the price of Bitcoin toward $77,000 to $77,500. If BTC fails at $75,000 and slides back below $73,500, sellers would be back in control, with $72,700 the next test. A third path is a sideways range between roughly $72,700 and $75,500 while indicators stay mixed.
Beyond the charts, the next daily flow reports will show whether the four-day withdrawal streak stretches to a fifth session, and the coming weekly close will determine whether the decline reaches six straight weeks.
This article is for informational purposes only and does not constitute financial or investment advice. Cryptocurrency and exchange-traded products carry market risks. Technical levels and historical fund flows do not guarantee future performance.

