Bitcoin Price Struggles Below $84K as US Spot BTC ETFs Post $65.4M in Daily Outflows
Key Takeaways
- •U.S. spot Bitcoin ETFs recorded $65.4 million in net outflows on Oct. 12, with BlackRock's IBIT responsible for the entire daily withdrawal.
- •Bitcoin rebounded from the $81,000 area to retest the $84,000 zone, supported by spot exchange buying even as ETF investors pulled capital.
- •Bitcoin ETF net outflows reached $681.1 million for the week ending Oct. 9, and total category net assets fell to $106.06 billion from $110.77 billion on Oct. 5.
- •Spot Ethereum ETFs lost $85.4 million on Oct. 12, marking an eighth consecutive session of outflows and bringing withdrawals since Oct. 1 to roughly $720 million.
- •Technical analysis identifies $84,500 as the key level, with a confirmed break above potentially extending gains toward $86,700 while rejection could send prices back to support near $83,000.
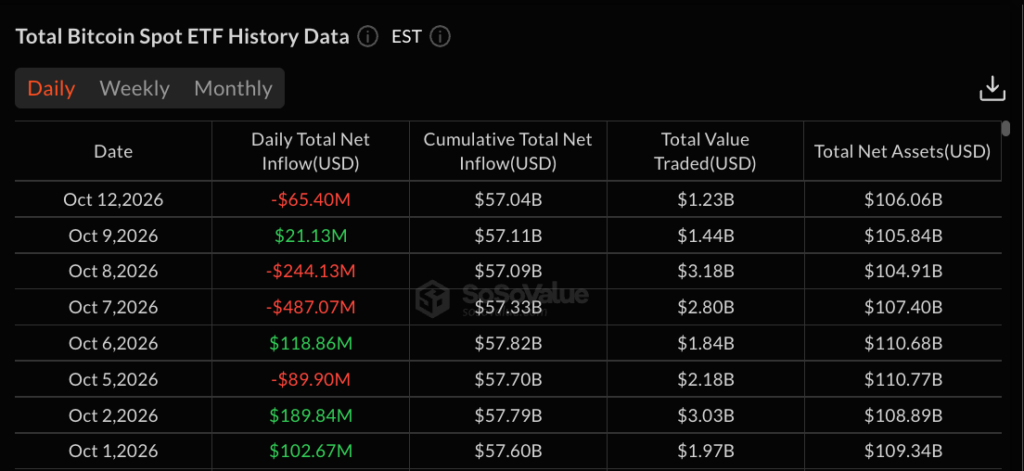
Bitcoin's price struggled to hold the $84,000 level as U.S. spot exchange-traded funds (ETFs) posted $65.4 million in net outflows, renewing pressure on the leading cryptocurrency. The withdrawals came on Monday, Oct. 12, reversing the previous trading session's modest inflows, and left Bitcoin trading just under $84,000 after a rebound from the $81,000 area.
BlackRock's iShares Bitcoin Trust (IBIT), the largest U.S. spot bitcoin fund by assets, accounted for the entire daily net withdrawal, according to Farside Investors. Spot Ethereum ETFs, meanwhile, reported another $85.4 million in outflows, extending their withdrawal streak to eight consecutive trading days.
Bitcoin Stabilizes Below $84,000 While ETF Flows Weaken
BTC dipped toward $81,000 before buyers stepped in. The recovery since then has been quick, with a run of green hourly candles carrying the price back to the $84,000 area — a level that has capped every push higher so far.
The timing of the bounce stands out. It arrived while ETF investors were still pulling money out, meaning spot buying on exchanges is doing most of the heavy lifting. If outflows keep building, that support could thin out fast.
Total net assets across Bitcoin ETFs now stand at $106.06 billion, down from $110.77 billion on October 5 — still a substantial base for a category that only launched in January 2024. Part of that drop stems from lower BTC prices and part from redemptions.
Bitcoin ETFs Log $65.4 Million Outflow After Brief Inflow
Monday's $65.4 million outflow followed a modest $21.13 million inflow on Friday, October 9. Bitcoin ETFs saw $681.1 million in net outflows for the week ending October 9, with most of the damage coming midweek: $487.07 million left the funds on October 7 and another $244.13 million exited on October 8. The prior week had closed with $241.09 million in net inflows.
Because spot ETFs buy and sell bitcoin to match daily share creations and redemptions, these flow tallies are widely tracked as a read on demand from brokerage and institutional investors. Trading activity also cooled. Total value traded on Monday came in at $1.23 billion, well below the $3.18 billion recorded on October 8.
Ethereum ETFs remain in a weaker position. Spot ETH funds lost $85.4 million on October 12, their eighth straight day of outflows. Between October 1 and October 12, roughly $720 million left these products, and total net assets for Ethereum ETFs dropped to $15.86 billion from $17.71 billion at the start of the month.
Bitcoin Price Analysis: Can BTC Reclaim $84,000?
On the 1-hour chart, BTC shows short-term bullish strength after recovering from the $81,000 to $82,000 range. Consecutive green candles point to real buying pressure, and the price is now testing the $84,000 zone.
RSI readings sit at roughly 76, 64 and 58. The fastest line is above 70 — a threshold conventionally viewed as overbought — which suggests strong buying momentum but also leaves room for a short pullback. The MACD histogram has turned positive with expanding green bars, indicating that upward pressure is building in the short term.
In the bullish scenario, BTC breaks above the $84,000 to $84,500 range and holds that zone on a retest. The next target would be $85,000, followed by the previous high near $86,700.
In the bearish scenario, BTC fails at resistance and sellers return. The price could then slide back to $83,000, with a deeper correction revisiting the $81,000 to $81,500 zone.
What Comes Next for Bitcoin
The short-term bias leans bullish, but resistance is close. The rebound, the positive MACD and the rising RSI favor buyers for now. However, the fastest RSI is already running hot, so chasing the rally before a confirmed breakout carries risk.
$84,500 is the level that matters most. A clean break above it could extend the recovery toward $86,700, while a rejection could send the price back toward support near $83,000.
ETF flows remain the wild card. The next daily flow prints will show whether Monday's single-fund outflow was an isolated event or the start of another sustained streak — and another week of heavy redemptions would make any breakout harder to hold.
This article is for informational purposes only and does not constitute financial or investment advice.

