Bitcoin Price Drops Below $62,000 as Spot BTC ETFs Log $582.19 Million in Daily Outflows
Key Takeaways
- •U.S. spot Bitcoin ETFs recorded $582.19 million in net outflows on Nov. 19, the largest single-day exit of a three-session withdrawal streak totaling about $1.13 billion.
- •Bitcoin's price dropped below $62,000, trading near $61,854 after dipping to roughly $61,290, as the token extended a slide that began in the $70,000–$75,000 range.
- •Spot Ethereum ETFs registered $131.24 million in net withdrawals on Nov. 19, their fourth straight day of outflows, with total net assets falling to $9.60 billion from $10.85 billion.
- •Spot Bitcoin funds posted weekly net outflows of $1.28 billion, $1.07 billion, and $1.12 billion across the three weeks ending Nov. 19, bringing combined redemptions to roughly $3.47 billion.
- •Technically, the $61,300–$62,000 zone is the near-term decision area: a break below $61,300 could open the path to $60,000, while $62,500–$63,000 forms the first upside hurdle.
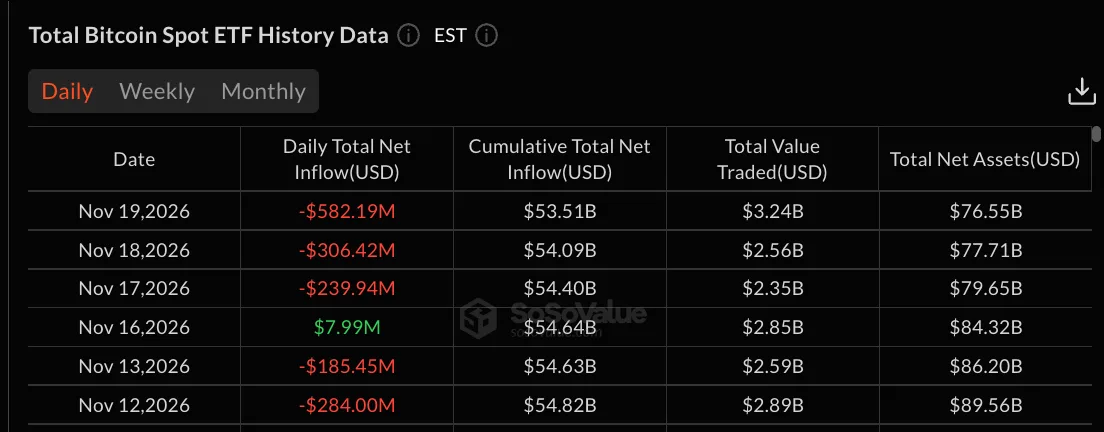
Bitcoin fell below $62,000 on Nov. 19 as U.S. spot Bitcoin exchange-traded funds (ETFs) posted $582.19 million in net outflows, the largest single-day exit of the current withdrawal streak. BTC traded near $61,854 during the downturn after touching approximately $61,290.
The withdrawals extended the Bitcoin ETFs' losing streak to three consecutive trading sessions, bringing combined outflows over that span to roughly $1.13 billion. Total net assets across the funds have since declined to $76.55 billion. Spot Ethereum ETFs also faced selling pressure in the same session, recording $131.24 million in net withdrawals — their fourth straight day of outflows.
Daily ETF flow figures, published after each trading session, have become one of the most closely watched gauges of institutional positioning in digital assets since U.S. regulators cleared spot Bitcoin ETFs for launch in January 2024, opening a regulated, brokerage-accessible route to BTC exposure for traditional investors.
Bitcoin Extends Slide From $70,000–$75,000 Range
The drop below $62,000 follows a steady slide that started near the $70,000 to $75,000 range. Since then, BTC has printed a series of lower highs and lower lows, and the most recent leg took the price from roughly $65,000 down to the $61,000 area in just a few sessions.
ETF flows have closely tracked the price decline. Spot Bitcoin funds posted $1.28 billion in weekly outflows for the week ending Nov. 6 and another $1.07 billion for the week ending Nov. 13. The week ending Nov. 19 added $1.12 billion in net redemptions, marking three straight weeks of net withdrawals and bringing three-week losses to roughly $3.47 billion. With institutional demand fading, Bitcoin has had little support from the buyers who drove much of its earlier rally.
BTC ETF Outflows Accelerate to $582.19 Million
SoSoValue data shows BTC ETFs lost $239.94 million on Nov. 17 and $306.42 million on Nov. 18 before the $582.19 million exit on Nov. 19 — a combined total of about $1.13 billion across three trading days. The Nov. 19 figure was the largest of the streak, exceeding the prior two sessions combined. The only break in the trend came on Nov. 16, when the funds pulled in a modest $7.99 million.
Cumulative net inflows across all spot Bitcoin ETFs now stand at $53.51 billion, down from $54.82 billion on Nov. 12. Total net assets fell harder over the same period, from $89.56 billion to $76.55 billion, since falling prices cut the value of existing holdings on top of the redemptions. The mechanics also run in the other direction: under a spot ETF structure, sustained redemptions shrink the pool of Bitcoin the funds hold, which is why the daily flow reports are read alongside price as a gauge of net demand.
Ethereum ETFs Log Fourth Straight Day of Outflows
Ethereum funds are seeing the same trend on a smaller scale, with selling pressure building over the past several sessions. Spot ETH ETFs, which only began trading in July 2024, recorded $131.24 million in net outflows on Nov. 19 — the largest of the four-day stretch — following exits of $39.83 million, $29.09 million and $8.31 million over the prior three sessions.
Total net assets in Ethereum ETFs dropped to $9.60 billion from $10.85 billion on Nov. 13, while cumulative net inflows slipped to $11.31 billion. Daily traded value rose to $624.60 million, again the highest level of the week. When Bitcoin and Ether funds bleed capital at the same time, it usually points to a broad risk-off mood among institutional investors, the report noted.
Technical Picture: The Battle Around $62,000
On the 1-hour chart, the structure remains bearish. BTC is sitting close to its recent low, and buyers have yet to put together a convincing reversal. The zone between $61,300 and $62,000 has emerged as the near-term decision area: BTC has tested the $62,000 level several times, and the latest wick to the downside reached about $61,290.
A stable break below $61,300 would take the price another leg lower, with $60,000 standing out as the next psychological target. On the upside, the first hurdle sits between $62,500 and $63,000. A move above $63,500 would put Bitcoin into its first meaningful recovery zone, while $64,500 to $65,000 is the major resistance left over from the previous consolidation.
For now, the short-term bias stays bearish. If Bitcoin holds $61,300, a relief bounce toward $63,000 to $63,500 is possible. Losing that level would put $60,000 in play. Beyond the chart, the coming rounds of daily ETF flow data will show whether the Bitcoin and Ethereum withdrawal streaks extend into fresh sessions.
This article provides financial information and market analysis, not investment advice. Cryptocurrency prices remain volatile, and technical forecasts do not guarantee future performance.

