Bitcoin ETF Inflows Reach $433 Million as Fidelity Leads With $311 Million
Key Takeaways
- •U.S. spot Bitcoin ETFs recorded $433 million in net inflows on September 18, reversing nearly $746 million in midweek outflows.
- •Fidelity's FBTC drew $310.72 million, about 72% of the day's total, and BlackRock's IBIT added $108 million, meaning the two funds accounted for roughly97% of net inflows.
- •FBTC has attracted about $10.36 billion since its January 2024 launch, ranking behind BlackRock's IBIT, while all U.S. spot Bitcoin ETFs together hold $102.53 billion in assets, or roughly 6.29% of Bitcoin's market value.
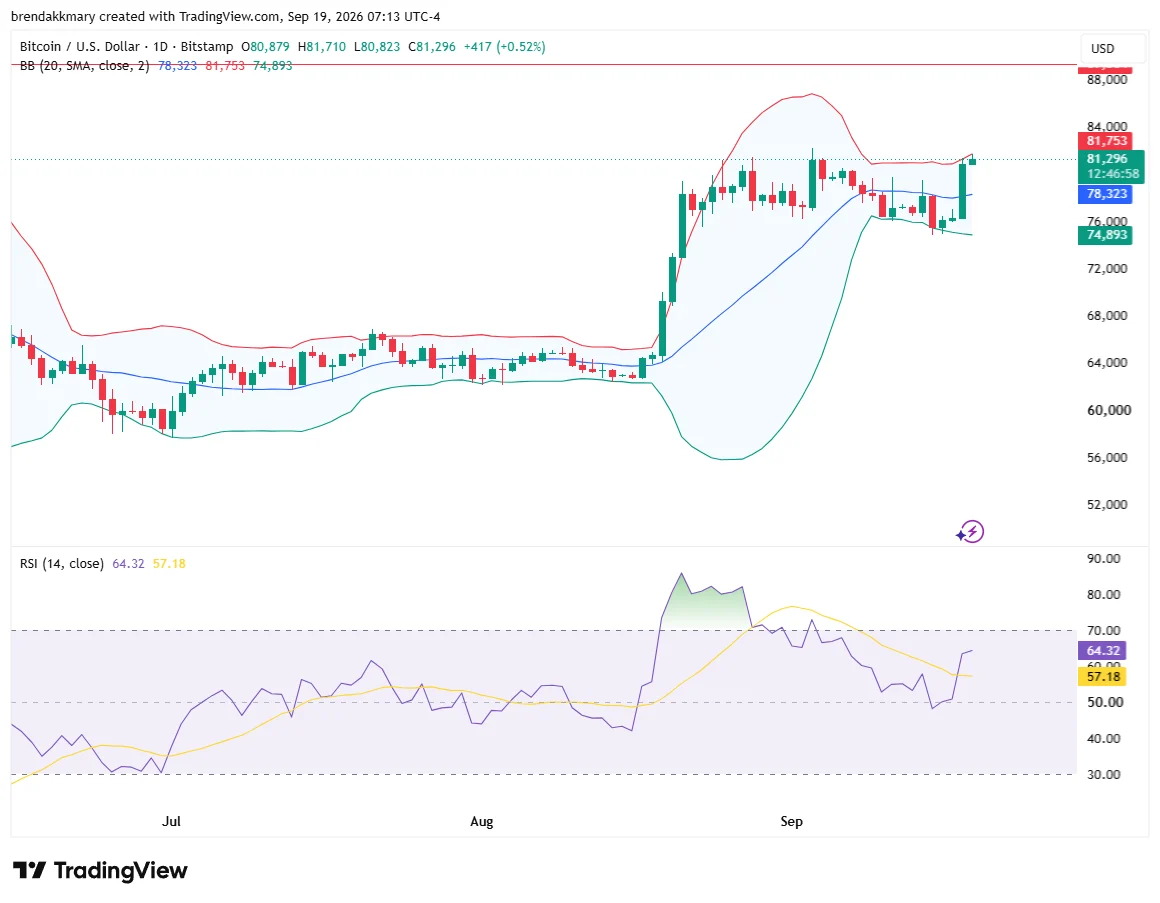
- •Bitcoin traded near $81,330 on September 19 with a daily RSI of 64.48, and technical traders are watching a sustained break above $83,000 toward $85,000, or a drop below $80,000 that could open the $78,300–$78,700 range.
- •Macroeconomic and regulatory developments remain relevant, as the Federal Reserve raised rates 25 basis points, the Bank of Japan lifted its benchmark to 1.25%, and the U.S. Senate rejected the CLARITY Act, delaying crypto market-structure legislation.
U.S. spot Bitcoin exchange-traded funds recorded $433 million in net inflows on September 18, led by Fidelity's Wise Origin Bitcoin Fund (FBTC), which attracted $310.72 million, or about 72% of the total. BlackRock's IBIT added $108 million, meaning the two funds accounted for about 97% of the day's net inflows.
The inflows coincided with Bitcoin moving toward $81,000 and testing nearby technical resistance. Total assets held by U.S. spot Bitcoin ETFs stood at $102.53 billion, equivalent to about 6.29% of Bitcoin's market value. The reversal followed nearly $746 million in midweek ETF outflows and offset part of the selling pressure recorded earlier in the week.
Fidelity and BlackRock Capture Most of the Inflows
FBTC's $310.72 million contribution was its strongest for the September 18 session and exceeded the inflows recorded by other spot Bitcoin products. The amount equaled roughly three-quarters of the fund's nine-day August buying streak, which brought in about $413.1 million across consecutive sessions.
ETFs bought $433,030,000 in $BTC yesterday. Fidelity alone bought $310,720,000 in Bitcoin. pic.twitter.com/T8drjUAB2l — Ted (@TedPillows) September 19, 2026
FBTC has recorded roughly $10.36 billion in net inflows since its launch in January 2024, when it debuted among the first U.S. spot Bitcoin ETFs authorized by the Securities and Exchange Commission — products that track Bitcoin's price through standard brokerage accounts without requiring investors to hold the asset themselves. By capital attracted, it ranks behind BlackRock's IBIT among U.S. spot Bitcoin ETFs. Collectively, the products now hold more than $102 billion in assets.
The September 18 data also highlighted the concentration of demand among a small number of funds. Fidelity and BlackRock captured nearly all net additions, while the remaining products accounted for only a small portion of the $433 million total. Because single-session totals hinge on the allocation decisions of a handful of large issuers, subsequent daily flow reports will show whether the rebound extended beyond one session.
BTC traded near $81,330 on September 19 after moving above the 20-day Bollinger midpoint at $78,346. The upper Bollinger Band was near $81,745, placing the price close to a short-term technical test. ETF inflows can support spot demand when funds create new shares, but daily flows do not guarantee continued price gains. Fund activity, derivatives positioning, macroeconomic policy and profit-taking can all affect subsequent market moves.
Bitcoin Tests $82,000 Liquidity and $83,000 Resistance
Bitcoin's daily relative strength index (RSI) rose to 64.48, above its signal average of 57.25. The reading indicated stronger momentum without exceeding 70, a level often associated with overbought conditions. Other indicators also leaned positive, including a bullish Supertrend and a positive Aroon spread.
CoinGlass liquidity data showed a dense cluster between approximately $81,800 and $82,000. Additional liquidation zones appeared around $82,500 to $83,000 and near $84,000. Nearby downside liquidity was identified around $80,000 and $79,400, while a larger support zone stood between $78,500 and $79,000, near the four-hour Supertrend and daily Bollinger midpoint.
Technical traders are watching $83,000. A sustained move above that level would take Bitcoin beyond the upper portion of its recent range and put $85,000 in view as the next nearby level. Conversely, a failure to hold $80,000 could shift attention toward $78,300 to $78,700. A deeper decline could reopen the $75,000 to $76,000 area, where liquidation data showed another broad concentration.
The lower Bollinger Band was near $74,948. CoinGlass data also showed leveraged positions concentrated between $75,000 and $76,000, adding another liquidity zone below the current range.
Macroeconomic and regulatory developments remain relevant. The Federal Reserve raised interest rates by 25 basis points, followed by the Bank of Japan increasing its benchmark rate to 1.25%. The U.S. Senate also rejected the CLARITY Act, delaying federal legislation on crypto market structure.
Source: Blockonomi

