Bitcoin Drops Below $64K as Rising U.S. Yields Lift Rate-Hike Odds
Key Takeaways
- •Bitcoin declined over 1.6% on Friday, pushing toward $64,000 as rising U.S. Treasury yields dampened appetite for risk assets.
- •Mosaic Asset Company cited the two-year Treasury yield at 4.31% as a principal driver behind the sell-off across both crypto and equity markets.
- •CME FedWatch pricing indicated expectations of no rate change at the next Fed meeting, while markets continued to factor in a 0.25% hike in September.
- •Analyst Rekt Capital observed that BTC is repeating 2022 bear market behavior around the 50-month EMA near $65,950, where recent rallies have faced rejection.
- •Traders identified layered buy-side liquidity on Binance near current prices, though a break below $64,000 would invalidate the short-term market structure.
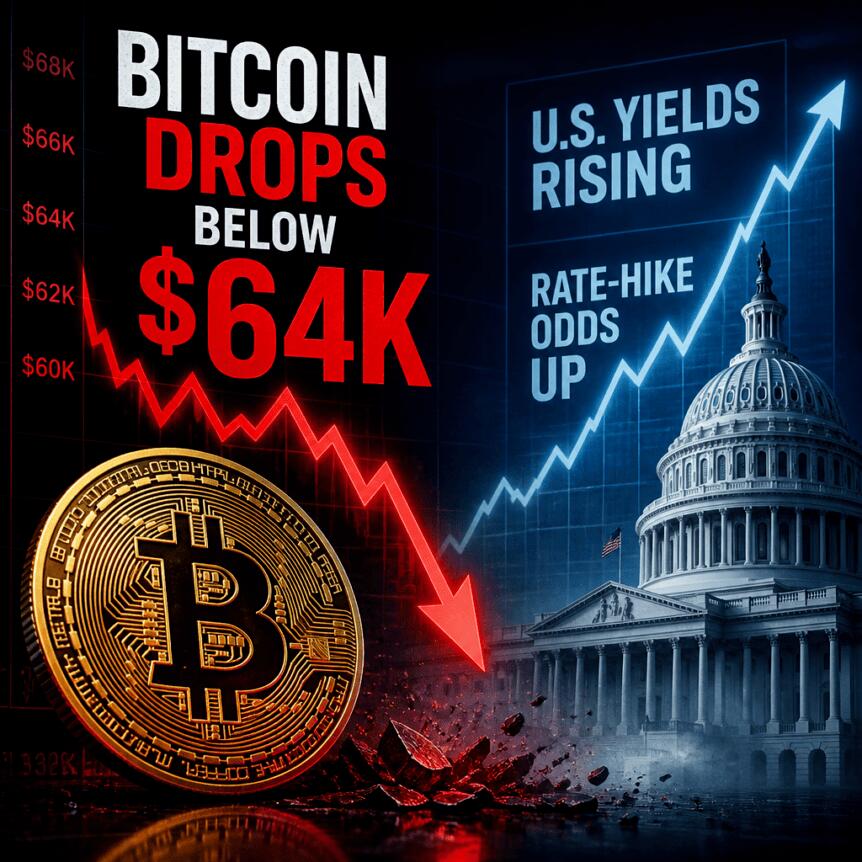
Bitcoin declined more than 1.6% on Friday, with selling pressure intensifying shortly after the Wall Street opening bell. The drop reflected growing caution among traders toward risk assets as U.S. bond yields climbed and expectations surrounding Federal Reserve policy shifted once again.
According to TradingView data cited in market commentary, BTC/USD pushed toward the $64,000 area as buyers struggled to hold earlier gains. The pullback underscored the extent to which cryptocurrency trading has continued to mirror traditional macroeconomic indicators—particularly interest rates. Higher Treasury yields can raise the opportunity cost of holding non-yielding or more volatile assets, which is why shifts in bond markets often feed quickly into crypto and equity risk sentiment.
BTC weakened rapidly following the U.S. market open, with price action nearing the $64,000 threshold. U.S. Treasury yields rose sufficiently to reinforce a more hawkish Federal Reserve outlook, weighing broadly on risk sentiment. Market monitoring identified concentrated buy-side liquidity on Binance that some traders believe could help stabilize short-term downturns. Meanwhile, CME FedWatch pricing continued to lean toward no rate change at the next Federal Reserve meeting, though the possibility of a September hike remained a subject of active debate. Several analysts characterized the current price pattern as a repetition of past market behavior, including rejections near key moving averages reminiscent of 2022.
Rising Yields Push Rate Expectations Higher
Geopolitical tensions and broader macroeconomic headwinds were cited as additional factors dampening risk appetite. A report from Mosaic Asset Company identified rising Treasury yields as a principal catalyst behind the sell-off.
Mosaic linked the market moves to volatility across the yield curve, describing ongoing "massive moves" even after the latest U.S. consumer inflation reading came in below expectations. The firm emphasized that the short end of the curve—particularly the two-year yield—wields outsized influence over expectations regarding the future trajectory of the Fed's policy rate.
Specifically, Mosaic noted that the two-year yield stood at 4.31%, remaining "well above" the Federal Reserve's target range. This dynamic applied downward pressure on risk assets as traders recalibrated expectations toward additional rate increases.
To assess market positioning, the report referenced the CME Group FedWatch Tool. The data indicated expectations that the Fed would hold rates unchanged at its next scheduled decision, while markets continued to price in a 0.25% hike in September—one of two increases anticipated before the end of 2026.
Mosaic further argued that these rate probabilities were contributing to weakness beyond the crypto market, noting they were "placing downward pressure on stock indexes." For traders, the practical implication is that BTC's near-term trading range is likely to remain highly sensitive to further yield spikes and any incremental repricing of Fed policy probabilities.
Traders Monitor $64,000 as Structural Test Intensifies
On the cryptocurrency side, short-term technical analysis centered on how BTC would behave as it neared the $64,000 zone. A recurring theme in trader commentary was that liquidity positioned below spot prices can sometimes blunt sell-offs—at least on a temporary basis.
Crypto trader Killa described what they called a "textbook setup," asserting that BTC was repeating a pattern observed on multiple previous occasions. In a post from early June, Killa had referenced a "plunge protection team" active on Binance, suggesting that layered bid liquidity could absorb downward pressure if triggered.
That concept resurfaced in current market monitoring. Killa pointed to an order-book view revealing multiple layers of liquidity below the prevailing price. The implication, as Killa presented it, is that the entities behind those bids may not necessarily be seeking immediate fills—meaning the market could experience stability during the initial phase of a drawdown, even if longer-term trend signals remain ambiguous. Order-book liquidity can also change quickly, so traders often treat visible bid walls as one input rather than confirmation of durable support.
Another analytics account, Wealthmanager, underscored the significance of the $64,000 area as a structural checkpoint. The account warned that a break below $64,000 would "invalidate" the low-timeframe market structure. For active traders, this frames the current move not merely as routine volatility, but as a critical test of whether the market can sustain a near-term support regime.
Rejection Theory Returns: 2022 Parallels and Moving-Average Tests
Separate from the liquidity-focused perspective, analyst Rekt Capital reinforced a longer-term pattern interpretation. The trader argued that BTC/USD was exhibiting tendencies consistent with its 2022 bear market, specifically highlighting behavior around the 50-month exponential moving average (EMA).
Rekt Capital stated that BTC has shown "no evidence" contradicting that thesis, concluding that the asset continues to follow established historical patterns. The referenced analysis included a 50-month EMA level near $65,950, an area where BTC has recently encountered rejections.
While this does not automatically predict immediate price direction, it carries significance for how traders may calibrate expectations. If BTC continues to reject around the same macro-relevant moving average, rallies may struggle to gain traction, and any subsequent breakdown toward lower support levels could unfold more rapidly than bullish participants anticipate.
Macro and Crypto Narratives Converge
The current drawdown sits at the intersection of macroeconomic rate expectations and crypto-specific market microstructure. On one hand, bond yields have functioned as a direct sentiment driver, with Mosaic's analysis pointing to the two-year yield as a critical variable shaping expectations for Federal Reserve actions. On the other hand, trader observations regarding Binance order-book liquidity suggest there may be pockets of demand positioned to cushion deeper declines.
Going forward, traders are watching whether BTC can reclaim and sustain levels in the mid-$60,000 range—particularly the zone referenced in moving-average analysis—or whether the market will break through the $64,000 structural threshold. In parallel, any renewed shift in CME FedWatch probabilities, combined with further movements in the two-year Treasury yield, could quickly determine whether Friday's sell-off evolves into a broader risk-off episode or fades into a period of consolidation.

