Bitcoin’s Current Drawdown Remains Below Historical Cycle Averages
Key Takeaways
- •Bitcoin's drawdown on October 12, 2026, measured approximately 33% to 34% across data providers, below Bitbo's historical average drawdown of 42.8%.
- •The current cycle's maximum drawdown of 52.92% at the July 1, 2026 low of $58,589 was the shallowest among the five episodes listed by Bitcoin.com, compared with an approximately 84.8% average maximum decline for the four completed bear markets.
- •Bitcoin declined for 268 days from the October 6, 2025 peak to the July low, the second-shortest decline phase among the listed episodes, and the cycle stood at day 371 on October 12, with completed cycles historically requiring 631 to 1,177 days from peak to full recovery.
- •CoinShares reported that Bitcoin touched its 200-week moving average in June 2026, the sixth such episode in its analysis, with the price higher one year after the first touch in each of the five earlier completed cases.
- •A 7.61% pullback between October 5 and October 9, 2026, nearly matched the 7.58% average pullback of the 2022-2025 cycle, according to CryptoQuant analyst MAC_D's data reported by Chainthink.
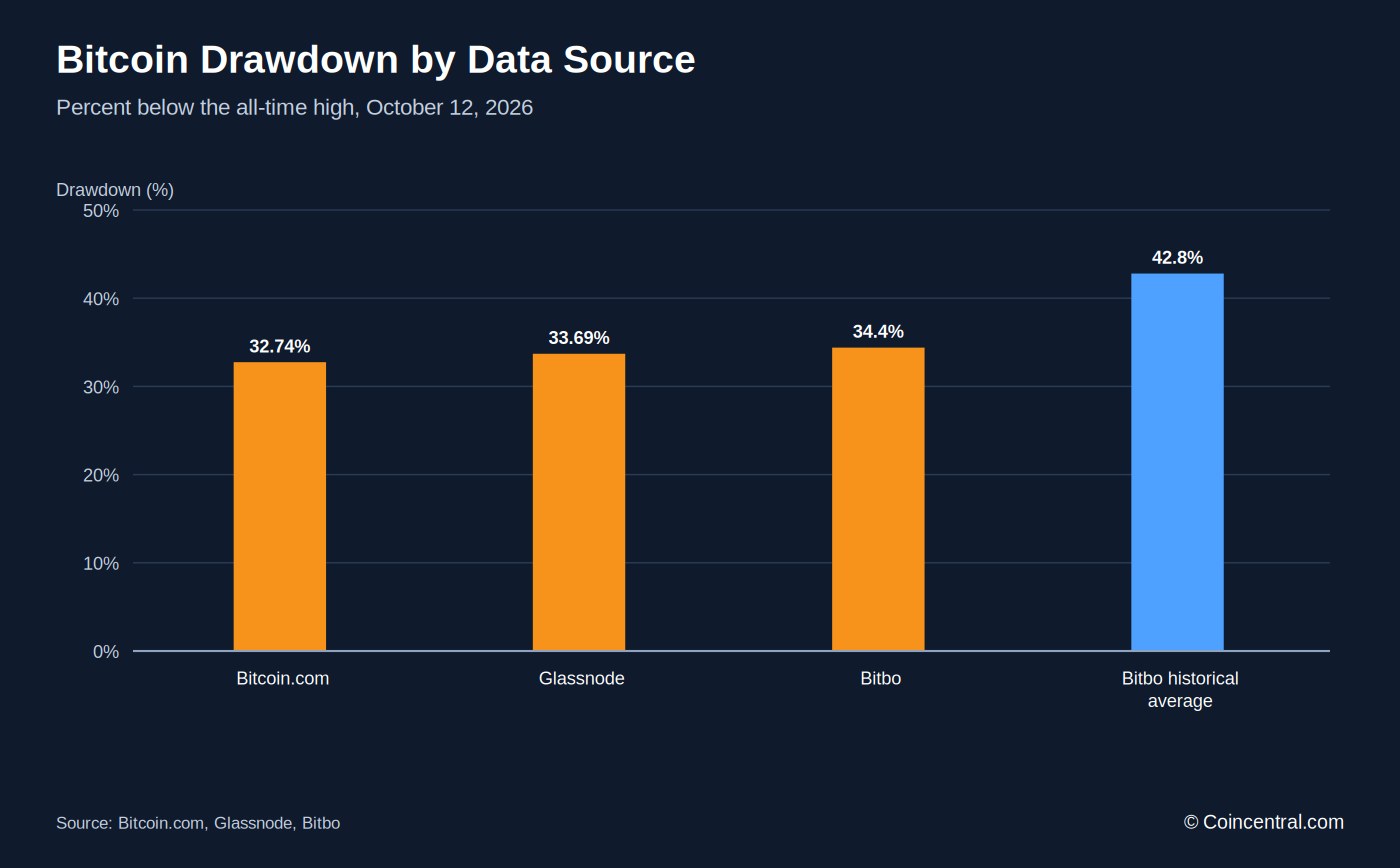
Bitcoin was trading roughly one-third below its all-time high as of October 12, 2026. Bitcoin.com listed the price at $83,700, or 32.74% below the peak recorded on October 6, 2025. This article compares the current drawdown with earlier Bitcoin market cycles using data from Bitcoin.com, Bitbo, Glassnode, CoinShares and Chainthink.
A drawdown measures the percentage decline from an asset’s highest price to a later price. It describes the asset’s path from its own peak, independent of where any individual buyer entered the market. The metric allows price declines to be compared across periods in which Bitcoin traded at very different absolute values. The figures cited by different providers vary slightly because each uses its own price feed and update schedule.
Bitcoin’s Current Position
Three providers show a broadly similar picture. Bitcoin.com reported a price of $83,700 and a drawdown of 32.74% on October 12, 2026. Glassnode reported a 33.693% drawdown, while Bitbo showed a 34.4% decline at a price of $82,726.
The difference between the highest and lowest drawdown readings was 1.66 percentage points. Small variations in price feeds and update times account for much of the gap. Bitbo says its data is refreshed every four hours, meaning its reading may temporarily lag the figures from other providers.
The providers also use slightly different all-time-high prices. Bitcoin.com records a peak of $124,448, while Bitbo records $126,102. Both identify October 6, 2025, as the date of the high. The $1,654 difference represents approximately 1.3% of the lower figure. Because a drawdown is calculated from the peak, a higher recorded high produces a larger percentage decline.
Bitcoin.com and Bitbo both counted 371 days since the October 6, 2025, peak. Bitbo lists the historical average drawdown at 42.8%, placing the current reading of approximately 33% to 34% below that average.
Bitbo identifies the deepest drawdown in its historical record as 91.4%, reached on October 20, 2011. Bitcoin.com records the 2011 decline at 93.58%. Bitcoin.com has noted that prices on early exchanges varied substantially, which can explain the difference between the two estimates.
Glassnode defines drawdown as the percentage decline in an asset’s price from its previous all-time high. That definition applies to the figures discussed here. A drawdown is a moving snapshot: it changes with every price movement and returns to zero only when the asset reaches a new high. If Bitcoin were to exceed its previous record, the measurement would reset from the new peak.
For comparisons to remain consistent, a provider’s current reading should be matched with that same provider’s historical figures. Combining a current reading from one source with a historical high from another can introduce differences in both the price feed and the reference peak.
The October 2025 Peak and July 2026 Low
The current cycle began with the October 6, 2025, peak. Bitcoin.com records the price at $124,448 on that date, while Bitbo records $126,102.
Bitcoin then declined for 268 days before reaching the low identified by Bitcoin.com on July 1, 2026, at $58,589. Based on Bitcoin.com’s figures, the maximum drawdown was 52.92%.
CoinShares examined the same period in a research note published on July 29, 2026. The firm said Bitcoin touched its 200-week moving average in June 2026 after falling more than 50% from the October 2025 high. The June contact with the moving average and the July 1 low occurred during the same extended period of weakness.
Bitcoin recovered part of the decline after the July low. Using Bitcoin.com’s figures, the price of $83,700 was approximately 42.9% above $58,589, but remained 32.74% below the all-time high. The drawdown therefore narrowed by 20.18 percentage points, from 52.92% at the low to 32.74% on October 12.
Bitcoin.com calculated that a price of $83,700 would need to increase 48.68% to return to its recorded high of $124,448. The required percentage gain is larger than the drawdown because the gain would be measured from a lower starting price.
A cycle low can be identified with certainty only after the fact. If Bitcoin were to fall below $58,589, the maximum-drawdown figures in this comparison would change. All figures in this article reflect data available as of October 12, 2026.
The peak-to-current period was close to one year. Bitcoin.com and Bitbo both counted 371 days from October 6, 2025. During that period, Bitcoin moved from the record high to the July low and then recovered part of the decline. Although the two sources differ by approximately 1.3% on the peak price, both describe a record set in early October 2025 followed by a decline of more than half over the next nine months.
Comparison With Earlier Bear Markets
Bitcoin.com lists five major drawdown episodes, including four completed cycles and the current cycle, which remains in progress. In this dataset, each episode runs from a record high through the decline that follows, and it is counted as complete once Bitcoin returns to that previous high. The earlier episodes were as follows:
- In the 2011 Mt. Gox crash, which takes its name from the early Bitcoin exchange, Bitcoin fell from $31.91 on June 8 to $2.05 on November 18, a decline of 93.58%.
- The first full cycle peaked at $1,163 on December 4, 2013, and bottomed at $178 on January 14, 2015, for a decline of 84.69%.
- The second cycle peaked at $19,783 on December 17, 2017, and bottomed at $3,217 on December 15, 2018, for a decline of 83.74%.
- The third cycle peaked at $68,789 on November 10, 2021, and bottomed at $15,782 on November 21, 2022, for a decline of 77.06%.
- The current cycle reached a maximum recorded drawdown of 52.92% at the July 1, 2026, low and remains in progress.
Bitcoin.com cautions that early exchange prices were inconsistent, so the precise figure for the 2011 crash depends on the exchange used. Bitbo’s separate record places the deepest drawdown at 91.4% on October 20, 2011.
The four completed episodes declined 93.58%, 84.69%, 83.74% and 77.06%, respectively. Their average maximum decline was approximately 84.8%. The current cycle’s 52.92% maximum decline is about 31.9 percentage points below that average and is the shallowest maximum decline among the five episodes on Bitcoin.com’s list.
The data does not establish a rule about future cycles. Five observations are not enough to demonstrate that Bitcoin’s larger market or more developed infrastructure will consistently limit future declines. A new low in the current cycle would also change the comparison.
Percentage figures also conceal the difference in absolute prices. The 2011 decline took Bitcoin from roughly $32 to about $2, while the 2021-2022 decline took it from $68,789 to $15,782. Dollar losses became larger even as the percentage declines in the listed cycles became smaller.
Three of the four earlier peaks occurred in November or December: December 2013, December 2017 and November 2021. The current cycle’s October 2025 peak occurred somewhat earlier in the calendar year.
Duration of Declines and Recoveries
The depth of a drawdown is only one measure. Bitcoin.com also tracks the time from each peak to the bottom and from the peak to a full recovery. In this context, recovery means that Bitcoin returned to its previous high.
The 2011 decline took 163 days from peak to bottom. The first full cycle took 406 days, the second took 363 days and the third took 376 days. The average duration for the four completed episodes was 327 days. The current cycle reached its low after 268 days, making it the second-shortest of the five episodes listed.
Full recovery took substantially longer. Measured from the peak, the completed cycles required 631, 1,177, 1,095 and 852 days, respectively. The average was approximately 939 days, or about 2.6 years. CoinCentral calculated the time from the bottom to recovery by subtracting the days to the bottom from the days to full recovery.
The current cycle was at day 371 on October 12, 2026. Because the low occurred on day 268, approximately 103 days had passed since the low. Bitcoin.com classifies the cycle as still in progress.
Historical comparisons show a wide range rather than a fixed timetable. A recovery following the shortest completed case, 631 days from the peak, would be approximately 260 days away based on the October 12 position. A recovery matching the third cycle’s 852 days would be about 481 days away, while one matching the longest case of 1,177 days would be about 806 days away. These are comparisons with historical durations, not forecasts.
Every completed episode in the Bitcoin.com dataset eventually ended at a new high. CoinShares reported the same observation in its research. The firm said each drawdown shown in its chart, other than the current episode, ended when Bitcoin established a new price high.
CoinShares said the decline phase of the current cycle was shorter than the three complete cycles, which lasted between 363 and 406 days. Only the 2011 crash, at 163 days, was faster. The time from the bottom to recovery in the completed episodes ranged from 468 to 771 days. If the current cycle were to match that historical range, the comparable period would be approximately 365 to 668 days from October 12. This remains a historical comparison and does not predict the outcome of the current cycle.
Shorter Pullbacks Within Market Cycles
Not every decline constitutes a bear market. Bitcoin also experiences smaller pullbacks during broader rising-market periods. CryptoQuant analyst MAC_D tracked such pullbacks, and Chainthink reported the findings on October 9, 2026.
Between October 5 and October 9, Bitcoin fell from $87,027 to $80,404, a decline of 7.61%. MAC_D compared that move with average pullbacks during earlier bull-market cycles:
- 18.41% from 2010 to 2011;
- 21.71% from 2011 to 2013;
- 10.93% from 2015 to 2017;
- 19.39% from 2018 to 2021; and
- 7.58% from 2022 to 2025.
The recent 7.61% decline was nearly identical to the 7.58% average for the 2022-2025 cycle. MAC_D cited an overall historical average pullback of 14.39%. Applying that percentage to $87,027 would produce a level near $74,500. That calculation is based on the historical average and is not a price prediction.
MAC_D also said investors might gradually accumulate around $80,000 and add more between $74,000 and $75,000. Those comments represent one analyst’s view and are not investment advice. Prices can move beyond any cited level.
These pullbacks are measured differently from the drawdowns discussed earlier. They begin with a recent high of $87,027 rather than the all-time high of $124,448. Bitcoin therefore remained well below its all-time high after the short-term decline.
The source figures also cannot be combined without qualification. A simple average of the four older cycle averages is 17.61%, which is higher than the stated overall average of 14.39%. Chainthink does not explain how the overall figure was calculated, so the two figures should not be treated as identical measures.
Short-term pullbacks demonstrate that large price moves can occur without representing a full bear market. A 7.61% decline over four days can appear significant on a chart, but it was smaller than the average pullback recorded for four of the five listed cycles. The 2011-2013 cycle had the largest average pullback at 21.71%, while the 2015-2017 cycle had the mildest average among the older cycles at 10.93%. The recent cycle’s average was at the low end of the reported range.
The 200-Week Moving Average
CoinShares published its research note, “Bitcoin’s drawdown in context,” on July 29, 2026. The firm said Bitcoin had experienced declines of more than 50% on ten occasions during its 18-year existence.
CoinShares described Bitcoin as more volatile than most currencies and linked that volatility in part to Bitcoin’s limited current use as a payment method for goods. The firm also said many long-term holders view declines as opportunities to buy more.
In the CoinShares chart, every drawdown other than the current one ended with a new price high. The firm stated that no bear market or cycle downturn had proven permanent.
The research note examined Bitcoin’s 200-week moving average, a line that smooths approximately four years of price data. CoinShares said the moving average had acted as a near floor during past bear markets.
Across five completed occasions over an 11-year period, Bitcoin traded at or below the 200-week average. CoinShares said Bitcoin was worth more one year after the first touch in each case. The June 2026 contact was identified as the sixth episode.
CoinShares also warned that the sample was small and insufficient for firm statistical conclusions. The episodes occurred under different conditions, including thin market infrastructure in 2015, the pandemic liquidity shock of March 2020 and the decline in bitcoin lending in 2022.
The research note does not provide exact return figures from its forward-return chart, so no specific returns are included here. Its stated finding is directional: Bitcoin was higher one year after the first touch in five out of five completed cases. A past pattern does not guarantee a future result.
Coin issues crypto exchange-traded products, and the research note is marked as a marketing communication. That context is relevant when assessing its claims.
Because the 200-week average incorporates many weeks of data, it moves relatively slowly. It can therefore serve as a long-term reference point but not as a short-term trading signal. CoinShares also took a long-term perspective, saying investors who held through short-term downturns had in many cases seen their positions grow over time. The firm added that people who spend or borrow in dollars are more concerned with the exchange rate from day to day.
Recovery Mathematics
The percentage decline and the percentage gain required to recover are not equal. A 50% decline requires a 100% gain to return to the original level. The required gain can be calculated as the decline divided by one minus the decline.
Applying that calculation to the current data, a 32.74% drawdown requires a 48.68% gain to return to the Bitcoin.com high of $124,448. The 52.92% maximum drawdown at the July low would have required a 112.4% gain from $58,589.
The required rebound increases sharply as the decline deepens. A 77.06% decline requires approximately 335.9%, while an 84.69% decline requires about 553.2%. Recovering from the 93.58% decline recorded for 2011 would have required approximately 1,457.6%.
CoinCentral calculated the gain needed as the drawdown divided by 100% minus the drawdown. This calculation helps explain why a shallower decline has a different recovery profile: a smaller fall requires a smaller percentage rebound to reach the previous high.
Bitcoin.com’s chart labels a 20% decline as a correction, a 50% decline as a bear market and an 80% decline as a deep bear market. Under those labels, the current drawdown of about 33% lies between a correction and a bear market. The 52.92% decline at the cycle low crossed the chart’s bear-market threshold but remained well above the deep-bear threshold.
The calculation depends on the high used. Bitcoin.com records $124,448, while Bitbo uses $126,102. Using Bitbo’s high, a price of $82,726 would need to rise approximately 52.4% to reach the record.
Recovery mathematics also illustrates why bear markets can persist even after a substantial rebound. Following a 50% decline, a 50% gain leaves the price 25% below its previous high. A 100% gain is required to fully recover.
Using Bitcoin.com’s figures, Bitcoin had already gained about 42.9% from the July low by October 12. It would still need another 48.68% to reach the previous high. Those gains compound to the full 112.4% required from the bottom.
Current Cycle Compared With Past Cycles
Depending on the data provider, Bitcoin’s current drawdown was approximately 33% to 34% on October 12, 2026. That was below Bitbo’s historical average drawdown of 42.8% and well below the approximately 84.8% average maximum decline of the four completed bear-market episodes in Bitcoin.com’s dataset.
The current cycle reached a 52.92% maximum drawdown at the July 1, 2026, low. That was the shallowest maximum decline among the five episodes listed by Bitcoin.com. Bitcoin subsequently recovered part of the loss.
The low arrived after 268 days, faster than three of the four earlier completed episodes. Historical recoveries took between 631 and 1,177 days from the peak, while the current cycle was at day 371.
CoinShares reported that Bitcoin touched its 200-week moving average in June 2026, marking the sixth such episode in its analysis. Bitcoin was higher one year after the first touch in each of the five earlier cases, although CoinShares emphasized that the sample was small.
Chainthink’s report on MAC_D’s data placed the latest 7.61% short-term pullback close to the 7.58% average for the 2022-2025 cycle. The short-term data provides a separate view from the broader drawdown comparison.
The figures have several limitations. Each provider uses its own price feed and update time. The bear-market comparison contains only five episodes, including one that remains in progress. Past market behavior does not establish future results, and the calculations in this article are not financial advice.
No single source supplies every part of the comparison. Bitcoin.com provides the cycle data, Bitbo and Glassnode provide current drawdown readings, CoinShares provides longer-term context, and Chainthink reports the short-term pullback analysis.
For those monitoring Bitcoin’s cycle data, three measurements summarize the comparison: the percentage drawdown from the high, the number of days since the high and the percentage gain required to recover. Together, they describe the depth, duration and recovery distance of the current move.
Sources
- Bitcoin Drawdown from ATH — Bitcoin.com Bitcoin Charts & Analytics
- Bitcoin Price Drawdown from All-Time High — Bitbo
- BTC: Price Drawdown from ATH — Glassnode
- Bitcoin’s current drawdown is milder than historical averages, analyst says — Chainthink
- Bitcoin’s drawdown in context — CoinShares
- Original article — CoinCentral

