Bitcoin Double-Bottom Pattern Points to $100,000 Target as ETFs Draw $2.31 Billion
Key Takeaways
- •Bitcoin reached $87,392, its highest price since January 29, before pulling back into a heavy buyer cost zone between $85,000 and $86,500 where about 633,000 BTC last changed hands.
- •U.S. spot Bitcoin ETFs drew $2.31 billion over the four sessions ending September 22, with $999 million and $714.7 million on consecutive days marking the largest two-day inflow since October 2025.
- •Strategy and Strive jointly acquired 2,305 BTC in one week, surpassing the combined purchases of all public treasuries over the previous three months.
- •Technical analyst Ali Charts identified a double-bottom formation, viewing the $82,500 neckline as support and setting a $100,000 price target.
- •Bitcoin's supply in profit jumped from 63% to 78.2% in five days, while its MVRV ratio of 1.62 remains below the long-term average of roughly 1.8.
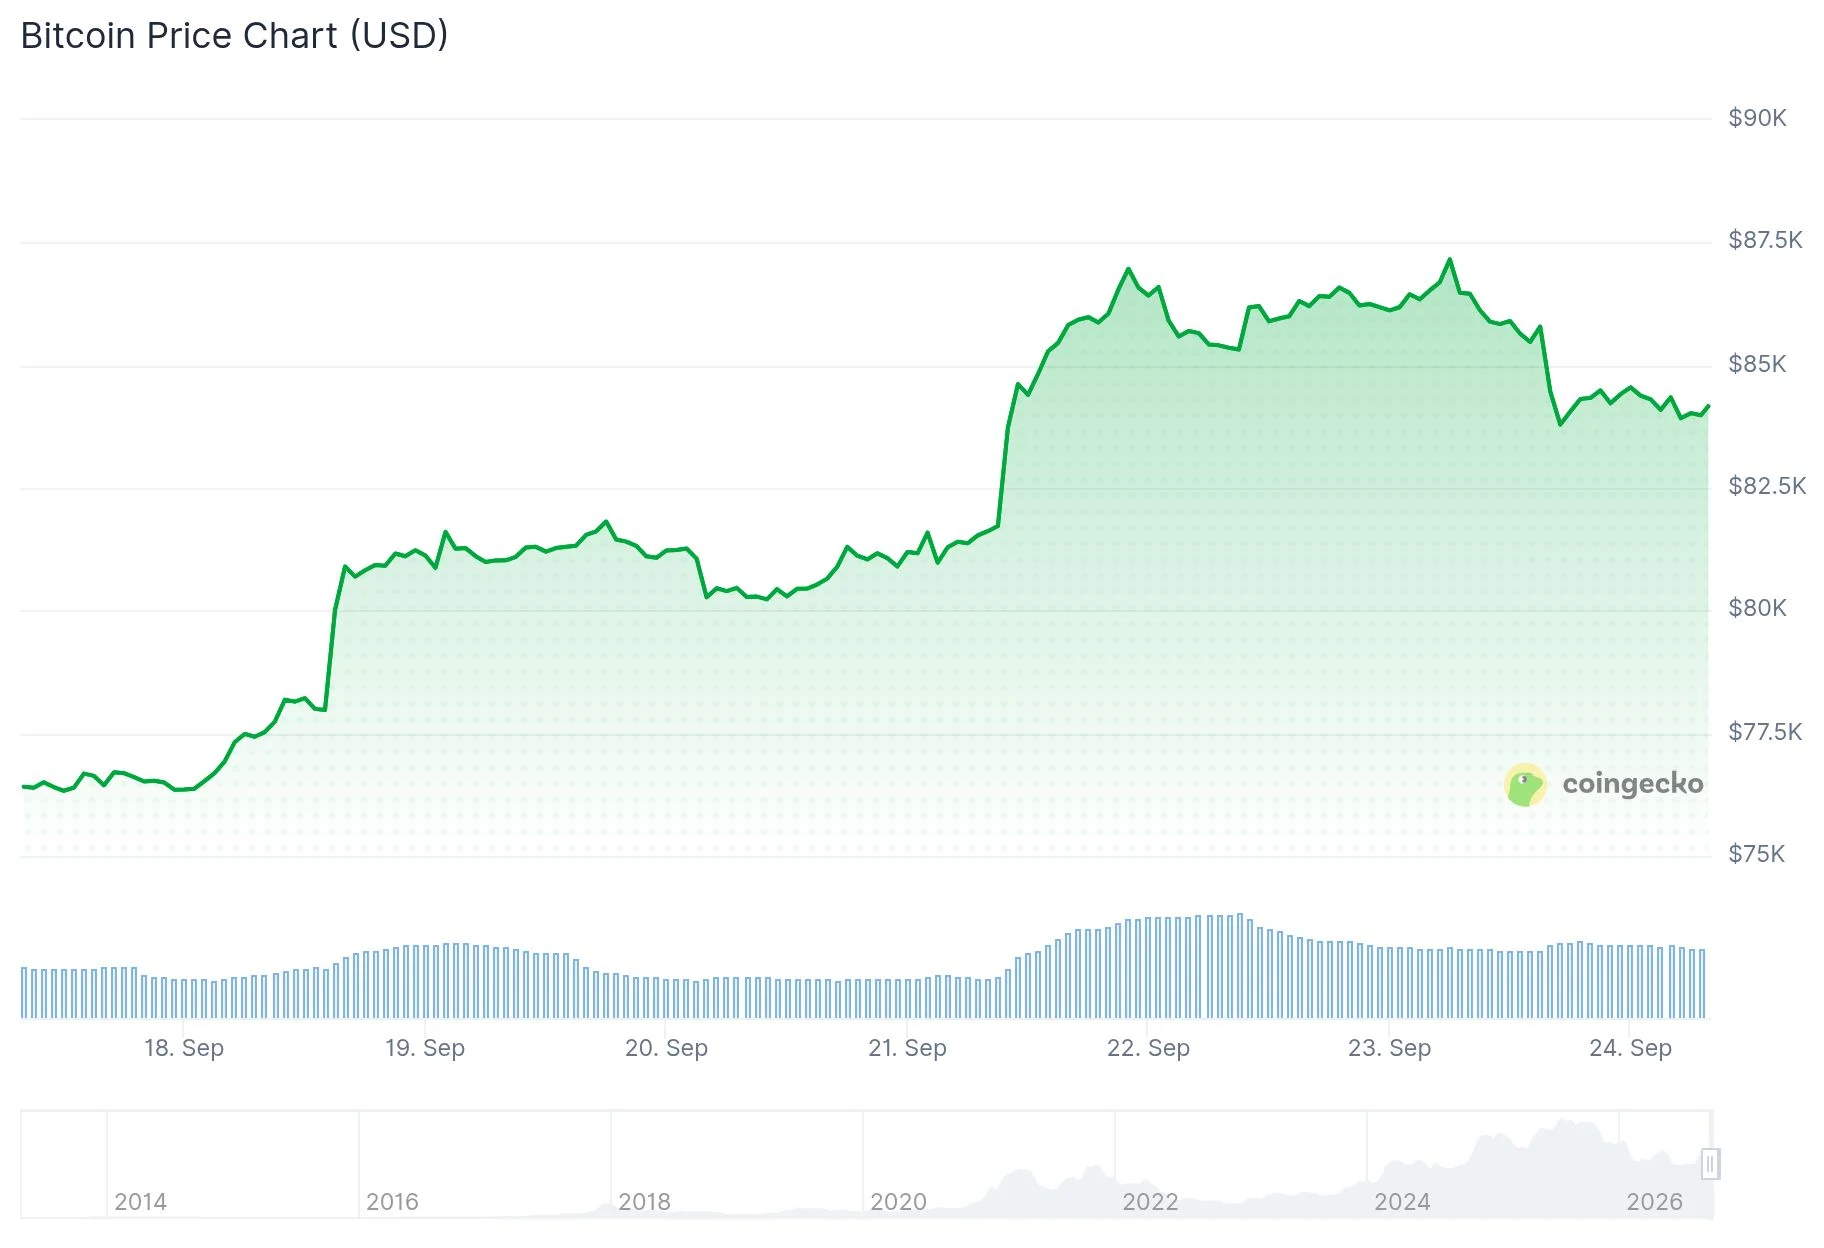
Bitcoin reached $87,392 this week, its highest price since January 29, before retreating into a dense buyer range between $85,000 and $86,500. Zones where large volumes of Bitcoin last changed hands are widely tracked because they act as reference points for how pullbacks are absorbed. Bitfinex analysts said holding that zone is the key test for the current rally.
About 633,000 BTC last changed hands between $85,000 and $86,500, making it the largest cluster of buyer cost data recorded during this rally. Roughly 2.95 million BTC moved into profit over four trading sessions as the price rose. Meanwhile, the amount of supply held between $80,500 and $82,500 declined from 252,000 BTC to 170,000 BTC per $1,000 price band.
Chart analyst Ali Charts said the recent move has formed a double-bottom pattern — a formation of two troughs near the same level separated by a peak, which technical analysts typically read as a bullish reversal signal once price holds above the connecting neckline. The $82,500 neckline is expected to act as support, and Ali Charts set a target of $100,000 if that level holds.
Bitcoin $BTC double bottom suggests the $82,500 neckline will hold as support. The target remains $100,000. pic.twitter.com/YwfQPJ8M56 — Ali Charts (@alicharts) September 23, 2026
U.S. spot Bitcoin exchange-traded funds recorded inflows of $999 million on September 21 and $714.7 million on September 22. The combined two-day inflow was the largest since October 2025. Because spot ETFs hold Bitcoin directly, net inflows represent coins purchased on behalf of investors, making fund flows a closely watched gauge of institutional demand.
Across the four sessions ending September 22, the ETFs absorbed $2.31 billion, equivalent to close to 27,900 BTC per day at average prices. The inflows followed a $450.4 million outflow on September 15, the largest single-day withdrawal since June.
ETF and Corporate Buying in Focus
Strategy, formerly known as MicroStrategy, bought 950 BTC for $75.7 million during the week ending September 20, bringing its total holdings to 846,000 BTC. Strive bought 1,355 BTC between September 14 and 18.
Together, the two companies acquired 2,305 BTC in one week, more than all public treasuries combined over the previous three months. Bitfinex said the ETF and corporate cohorts were both in profit at the same time this week for the first time since January. The average ETF cost basis is near $86,000, while the corporate treasury cost basis is about $80,500 — the average prices at which each cohort breaks even.
Trader Ted Pillows said Bitcoin’s position above its key levels confirms a cycle bottom, while adding that he still expects an 8% to 10% correction to clear late long positions.
$BTC is above all its key levels, which confirms a cycle bottom. But that doesn't mean up-only. IMO, Bitcoin will have an 8%-10% correction from here to flush out late longs. pic.twitter.com/6hcvO5ziQ0 — Ted (@TedPillows) September 23, 2026
The share of supply held in profit — the portion of all coins whose last on-chain purchase price sits below the current market price — rose from 63% on September 17 to 78.2% on September 22. Bitfinex said it wants that figure to remain above 75% through the first correction.
Bitcoin’s market value-to-realized value ratio, which divides market capitalization by the aggregate value of coins at their last on-chain purchase price, stood at 1.62 on September 22, below its long-term average of about 1.8. Analysts use the gauge to compare current valuations against past market cycles. Bitfinex associates that average with a price near $95,000 at the current realized value.
Analysts Assess the Rally
K33’s Vetle Lunde said the current drawdown has been shorter and shallower than those seen in previous cycles. Lunde also said still has room to catch up with gold and equities.
Nexo offered a more cautious assessment, citing thinning volume and narrower market breadth. The firm said rising leverage could leave the rally vulnerable to a pause.
Capital.com’s Daniela Hathorn identified resistance at $87,000 to $88,000, with $90,000 as the next hurdle. Hathorn said the first support zone to monitor is between $84,000 and $85,000.
Bitfinex placed the next test near Bitcoin’s yearly open at $87,722. The firm said that holding above $85,000 to $86,500, alongside continued ETF inflows, would open a path toward $90,000.
Source: CoinCentral

