Bitcoin (BTC) Drops Below $80K as $810 Million in Positions Liquidated Ahead of Fed Meeting
Key Takeaways
- •Liquidation data from Coinglass showed more than $810 million in leveraged crypto positions were wiped out over 24 hours, with roughly $689 million consisting of long positions caught on the wrong side of the decline.
- •U.S. spot Bitcoin ETFs recorded about $635.6 million in net withdrawals on October 22, led by outflows of $254.1 million from BlackRock's IBIT and $217.5 million from Fidelity's FBTC, according to Wu Blockchain.
- •Geopolitical risks, including the U.S. evacuation of personnel from Middle East sites and Brent crude trading above $117, have added to inflation concerns ahead of the Fed's October 27-28 meeting and the October 29 PCE release.
- •On the technical side, Bitcoin slipped below its 50-day moving average near $81,700, and traders are monitoring support levels around $78,400 and $77,876 for signs of stabilization.
- •Analyst Ted argued that Bitcoin is mimicking the fractal from its November 2022 bottom a pattern that could imply a worst-case low near $74,000-$75,000 followed by a reversal toward $90,000.
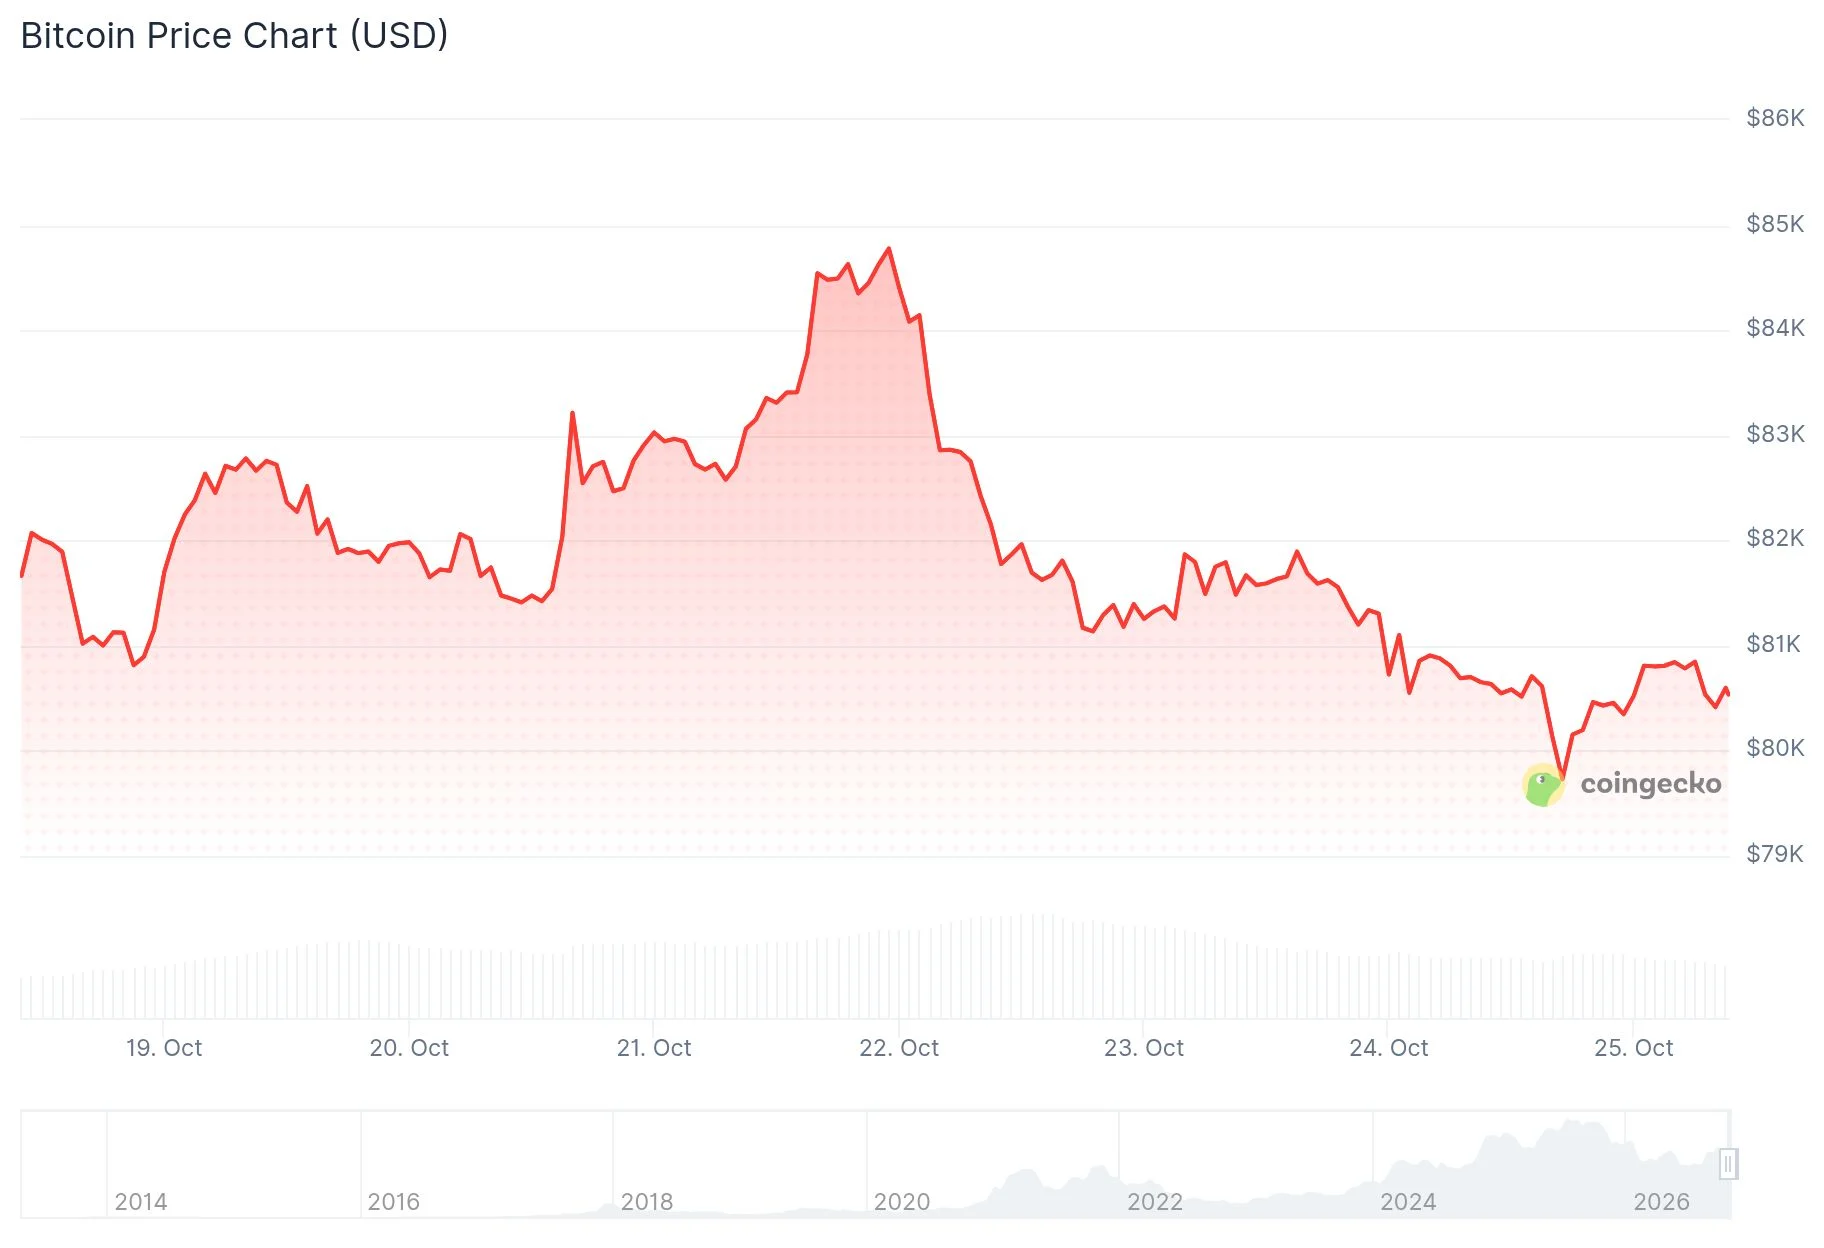
Bitcoin (BTC) slipped below the $80,000 level on Saturday, touching a low of $79,146 in its weakest showing in more than a month, before recovering to around $80,900. It was the first time the leading cryptocurrency had traded under $80,000 since October 15, and the drop came as more than $810 million in leveraged crypto positions were wiped out ahead of the Federal Reserve's October 27-28 meeting.
At one point, Bitcoin was down roughly 2.2% over 24 hours, trading near $79,700 amid thin weekend liquidity, a condition that can magnify price swings because fewer standing orders are available to absorb selling. Ether, XRP and Solana each fell between 3% and 4% over the same period.
Forced Selling Amplifies the Move
Liquidation data indicates that forced selling played a large part in the decline. Liquidations are the automatic closure of leveraged positions whose collateral no longer meets margin requirements, and clusters of them can turn a slide into a cascading sell-off. According to Bull Theory, long liquidations reached $219 million within a single hour, and more than $200 million was erased in just 15 minutes. Coinglass data shows that more than $810 million in positions were liquidated over 24 hours, with about $689 million of that total made up of bullish bets caught on the wrong side of the move.
ETF Outflows Add to the Pressure
Institutional flows added further strain. U.S. spot Bitcoins hold bitcoin directly, and their daily net-flow figures are widely tracked as a read on institutional demand for the asset. The funds recorded about $635.6 million in net withdrawals on October 22, according to Wu Blockchain. BlackRock's IBIT lost $254.1 million, while Fidelity's FBTC saw $217.5 million in outflows.
Spot Bitcoin ETFs Recorded $635M in Net Outflows on October 22
On October 22 (ET), spot Bitcoin ETFs recorded total net outflows of $635M, led by BlackRock's IBIT with $254M. Spot Ethereum ETFs recorded total net outflows of $111M, led by BlackRock's ETHA with $75.45M. pic.twitter.com/Vj2TzNyR03
— Wu Blockchain (@WuBlockchain) October 23, 2026
The outflows continued into the end of the week, with another $137.9 million leaving Bitcoin ETFs on Friday. Spot Ether ETFs also registered outflows, with roughly $110.6 million departing those funds on October 22.
Geopolitics and the Fed Take Center Stage
Geopolitical headlines weighed on broader markets. The Wall Street Journal reported that the United States is evacuating personnel from embassies and military bases across the Middle East, citing intelligence that Iran is preparing attacks on Americans. President Trump has separately said the U.S. may carry out another round of strikes on Iran after the midterm elections.
Brent crude is trading above $117, a level that has raised concerns about inflation; energy costs flow directly into consumer price readings, which in turn shape expectations for the interest-rate path the Fed sets.
The macro calendar is now in focus. The Federal Reserve meets October 27-28, and September inflation data on personal consumption expenditures follows on October 29. PCE is the inflation gauge the Fed has identified as its preferred measure, making the release a key input for rate expectations. Traders are watching for signs on whether interest rates will stay unchanged or rise.
Domestic politics add another layer of caution. Ash Crypto pointed out that the U.S. midterm elections, scheduled for November 3, are nine days away, noting that Bitcoin has historically corrected after each U.S. midterm vote.
We are just 9 days away from the US midterm elections.
History shows that after every U.S. midterm election, Bitcoin has experienced a correction.
Will this time be different? pic.twitter.com/2mtcaIjfdC
— Ash Crypto (@AshCrypto) October 25, 2026
Where Bitcoin Could Go Next
Analyst Ted offered a more upbeat view, arguing that Bitcoin is closely following the pattern from the November 2022 bottom, including the consolidation, rally and subsequent pullback. Fractal comparisons of this kind are a common analytical device, though they rest on the assumption that prior patterns repeat.
$BTC is exactly mimicking the fractal from the November 2022 bottom.
The consolidation, pump, and even correction are happening the exact way.
And here's what's interesting.
In the 16th week after 2022 bottom, BTC had a flash crash because of the US banking crisis.
We are… pic.twitter.com/PLbYO5cAST
— Ted (@TedPillows) October 24, 2026
In the 16th week after that bottom, Bitcoin experienced a flash crash tied to the U.S. banking crisis, and Ted said the market is now approaching that same week. If the pattern repeats, he expects a low around $74,000-$75,000 in the worst case, followed by a reversal toward $90,000.
Technical Picture
On the charts, Bitcoin slipped below its 50-day moving average, which sits near $81,700 and is commonly consulted as a medium-term trend gauge. Traders are watching support near $78,400 and $77,876 for indications of where the price could stabilize.
Sentiment, meanwhile, remains measured. The Fear and Greed Index stood at 42, a neutral reading. Bitcoin had recovered to $80,936 as of 00:53 ET on Sunday, trading close to $81,000.
Source: CoinCentral

