Bitcoin Crash Warning Flags Monday Risk as Bitcoin Cash Gains
Key Takeaways
- •A warning on X attributes possible October 5 market turmoil to Federal Reserve policy and tightening liquidity, comparing the S&P 500 with the Benner cycle, but the comparison does not establish that a crash is scheduled for that date.
- •The Fed's next scheduled policy meeting falls on October 27–28 rather than October 5, and official guidance indicates policy changes affect economic conditions neither directly nor immediately.
- •Bitcoin Cash rose 1.59% to $317.75 in 24 hours, outperforming Bitcoin's 0.25% gain, prompting social commentary about capital rotation into established Bitcoin forks such as BCH and Bitcoin SV.
- •Bitcoin Cash's 24-hour trading volume fell approximately 37% to about $152.9 million, weakening confirmation of the advance even though the price sits above its seven-day simple moving average of $313.88 with a 14-period RSI of 63.52.
- •Key Bitcoin Cash levels include Fibonacci support at $306.59, whose loss would expose the 50% retracement at $288.93, against resistance near $328.44 and the 328–330 band, while Bitcoin holding above $84,000 and spot ETF flows remain near-term reference points.
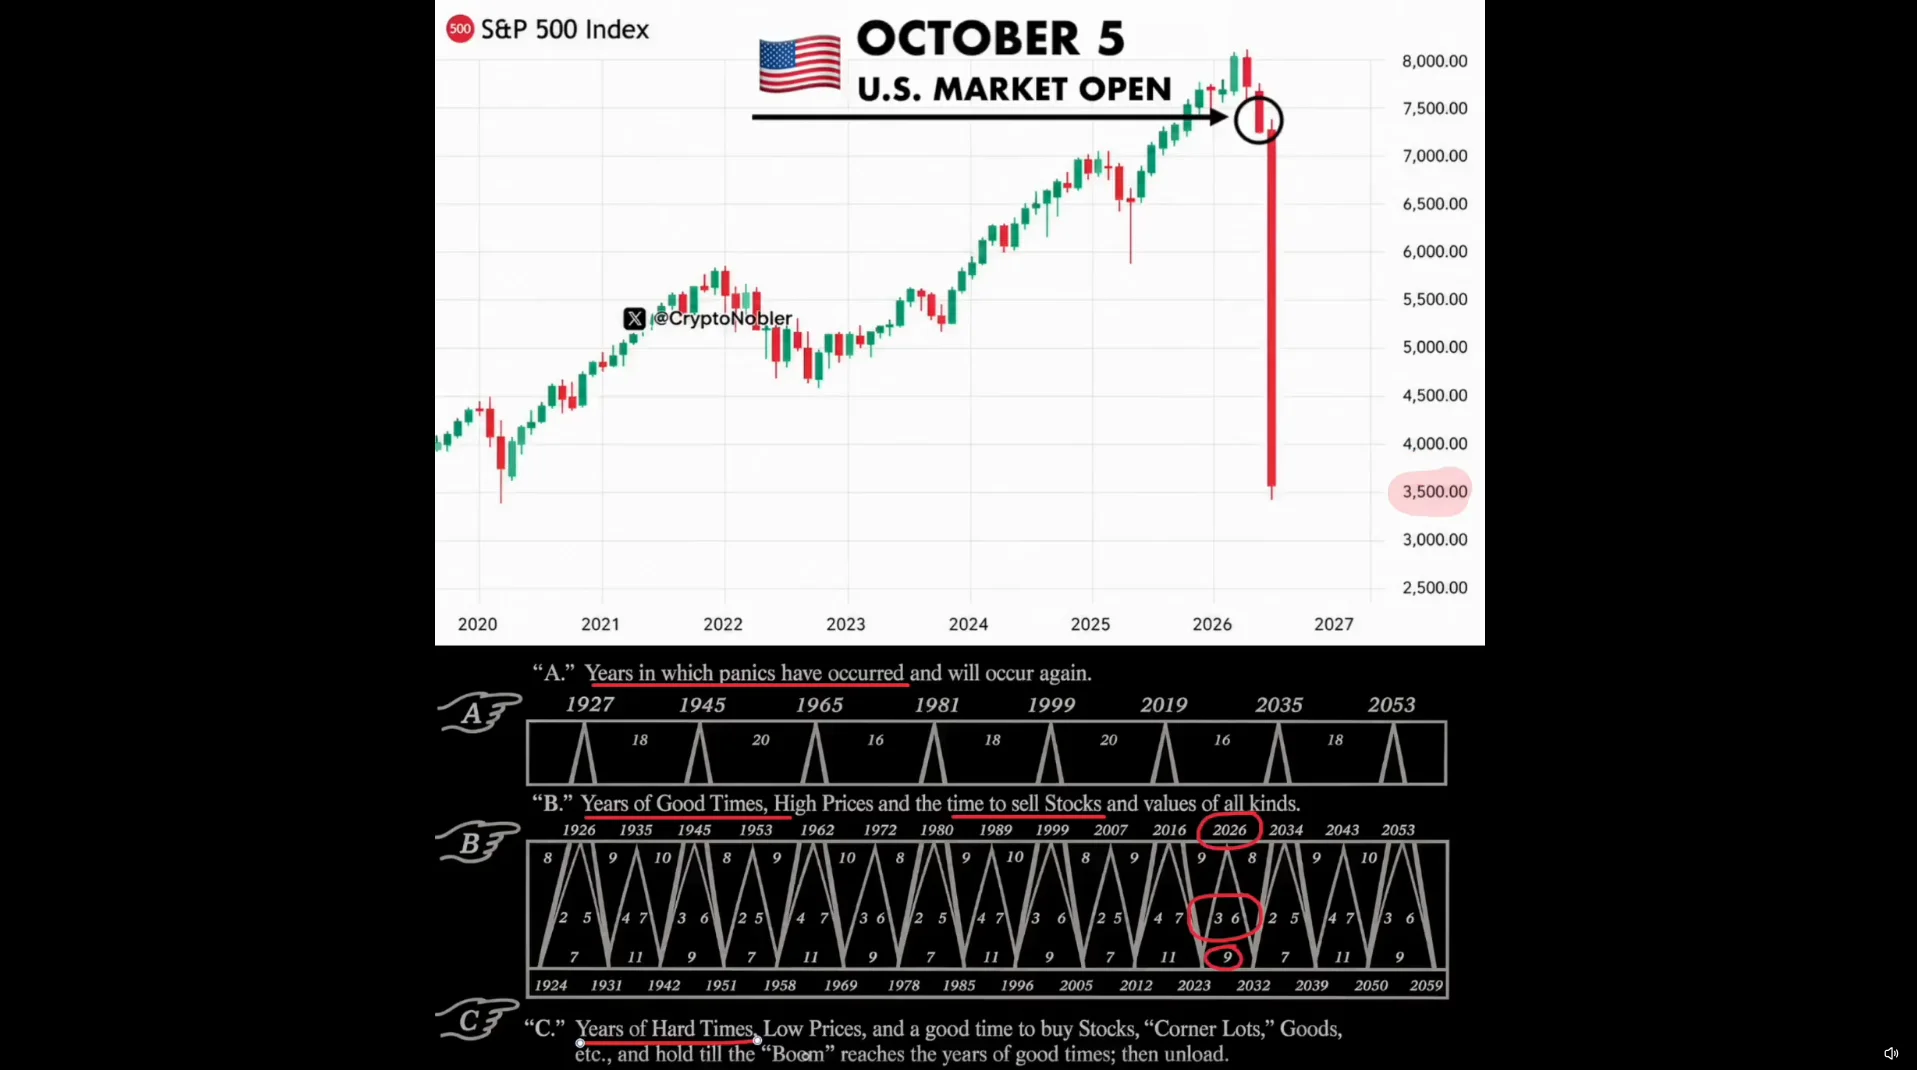
A Bitcoin crash warning circulating on X and relative strength in Bitcoin Cash have shaped market discussion heading into the new trading week, though the two developments point in different directions.
The warning links possible market turmoil on Monday, October 5, to Federal Reserve policy and tightening liquidity. It compares the S&P 500 with the Benner cycle, a historical framework for interpreting market fluctuations that traces to an 1875 cycle chart attributed to Samuel Benner, but that comparison does not establish that a crash is scheduled for October 5.
According to recent market data, Bitcoin Cash rose 1.59% to $317.75 over 24 hours, outperforming Bitcoin's 0.25% gain over the same period. The divergence has fueled discussion about renewed interest in established Bitcoin forks, and rotation into those forks remains a possible explanation. Falling trading volume, however, complicates the bullish picture. The warning itself offers a possible scenario rather than evidence of an imminent market breakdown.
Bitcoin Crash Warning Links Fed Policy to Yield Pressures
The warning argues that the Federal Reserve faces conflicting pressures from inflation, borrowing costs, and slowing growth. In this framing, higher rates could increase financing expenses, while easing could strengthen demand and revive inflation risks.
The post claims long-term Treasury yields have reached their highest levels since 2007. It also cites roughly $40 trillion in U.S. debt and compares potential American policy constraints with Japan. Those claims belong to the account's forecast and require verification against specific Treasury maturities and reporting dates.
Long-term yields differ from the overnight policy rate, a distinction that matters for the warning's yield claims. The U.S. Department of the Treasury publishes market-based readings across a range of maturities rather than one universal yield.
Official Federal Reserve guidance describes a broader process. Policy changes affect borrowing costs and financial conditions, but their economic effects are neither direct nor immediate. That weakens any suggestion that a single rate decision would automatically produce a market crash on a specific date.
In the warning's proposed transmission mechanism, tighter liquidity is followed by falling asset values. The account lists stocks, bonds, silver, and Bitcoin among the assets it considers vulnerable to forced selling. Such selling can occur when investors need to raise cash or when leveraged positions breach margin requirements. Identifying that possibility, however, does not establish its scale, timing, or likelihood.
A calendar distinction also matters. The Fed lists its next scheduled policy meeting for October 27–28, not October 5. The S&P 500 trades in weekday sessions while Bitcoin markets operate around the clock, so a Monday-specific call maps more directly to traditional-market reopenings than to crypto's continuous schedule. Markets can still move in the days before meetings as investors reassess inflation and growth, but the Benner cycle comparison remains an interpretation of past patterns. The warning supplies no demonstrated link between that historical pattern and a particular Monday selloff.
BCH Gains as Thinner Trading Volume Clouds Bullish Momentum
The warning contrasts with relative strength in Bitcoin Cash, although that strength does not remove broader risks. Bitcoin Cash split from Bitcoin in a 2017 hard fork, and Bitcoin SV later separated from Bitcoin Cash in 2018, a shared lineage that underpins the "fork sympathy" framing in the commentary below. Social commentary has linked interest in BCH and Bitcoin SV to derivatives headlines and possible capital rotation into established forks. One widely shared post framed the Bitcoin SV move as part of that same rotation:
$BSV MARKET UPDATE | OCT 2026
Bitcoin SV ( $BSV ) trades near $19.30 – $19.70, consolidating its recent 20% gains triggered by capital rotation into established forks!
Key Catalysts right now: Fork Sympathy Surge: Capital rotated heavily into BCH and BSV…
That explanation remains tentative. Differences in returns do not prove investors sold Bitcoin to fund purchases of its forks, and the rally lacks a clearly identified BCH-specific announcement in the accompanying market commentary.
Technical readings place Bitcoin Cash above its seven-day simple moving average, which stands at $313.88. Its 14-period relative strength index stands at 63.52, indicating positive momentum that remains below the conventional overbought threshold. Together, those readings describe short-term strength, though the volume picture tempers the signal: 24-hour trading volume fell approximately 37% to about $152.9 million. Lower turnover provides weaker confirmation of the advance, although volume alone does not measure the liquidity available in the market.
The nearest outlined support is $306.59, corresponding to the 38.2% Fibonacci retracement. Holding that area could support another test of $328.44, followed by the wider 328–330 resistance band. These Fibonacci levels trace the latest correction from a recent BCH swing high of $363.75. A sustained move through resistance would need stronger participation to improve the technical case, while losing $306.59 would expose the 50% retracement at $288.93.
The warning also keeps attention on Bitcoin's stability and spot ETF flows. U.S. spot Bitcoin ETFs report daily creations and redemptions, which makes their flows a widely tracked read on demand for the asset. Sustained inflows could improve sentiment, while outflows could add pressure across related assets. Bitcoin Cash remains sensitive to those broader conditions despite its daily outperformance. Bitcoin holding above $84,000 remains a near-term reference point, alongside BCH trading volume and the asset's response around Fibonacci support.
Source: Blockonomi

