Bitcoin Closes Below 200-Week Average as Wintermute Warns of Pressure Into the $50,000s
Key Takeaways
- •Bitcoin fell 12.7% over the week while the S&P 500 gained 2.5%, closing at $65,351 in its first weekly close below the 200-week moving average since August.
- •Wintermute warned of price pressure into the $50,000s, describing the rally from the July low as a fake-out and stating that the bear market has not been cleared.
- •Wintermute cited roughly $1.9 billion in net 2026 ETF outflows, a $16.1 billion 30-day stablecoin supply decline, a 92% implied probability of a December Fed rate hike, and $1.7 billion of liquidations that were 80% long positions.
- •River calculated that Bitcoin has spent 8.4% of its lifetime below the 200-week average, with purchases in those periods averaging returns of 120% after one year and 582% after three years.
- •Wintermute said it would become less defensive only after a daily close above the 200-week average near $68,000 paired with same-day net ETF inflows, with $61,000 as the first support level and $53,000 inside its target zone.
Bitcoin (BTC USD) closed last week at $65,351, marking its first weekly close below the 200-week moving average since August. The moving average, which represents Bitcoin’s average weekly close over roughly four years, was near $68,000 and is closely watched as a long-term trend gauge for the market.
On Monday, November 16, market maker Wintermute, a firm that provides buy and sell liquidity across crypto exchanges, warned that it expected “pressure into the $50s.” River, a Bitcoin broker, highlighted a contrasting historical pattern: Bitcoin has traded below its 200-week average for only about 8% of its lifetime, and purchases made during those periods have produced positive returns in the past.
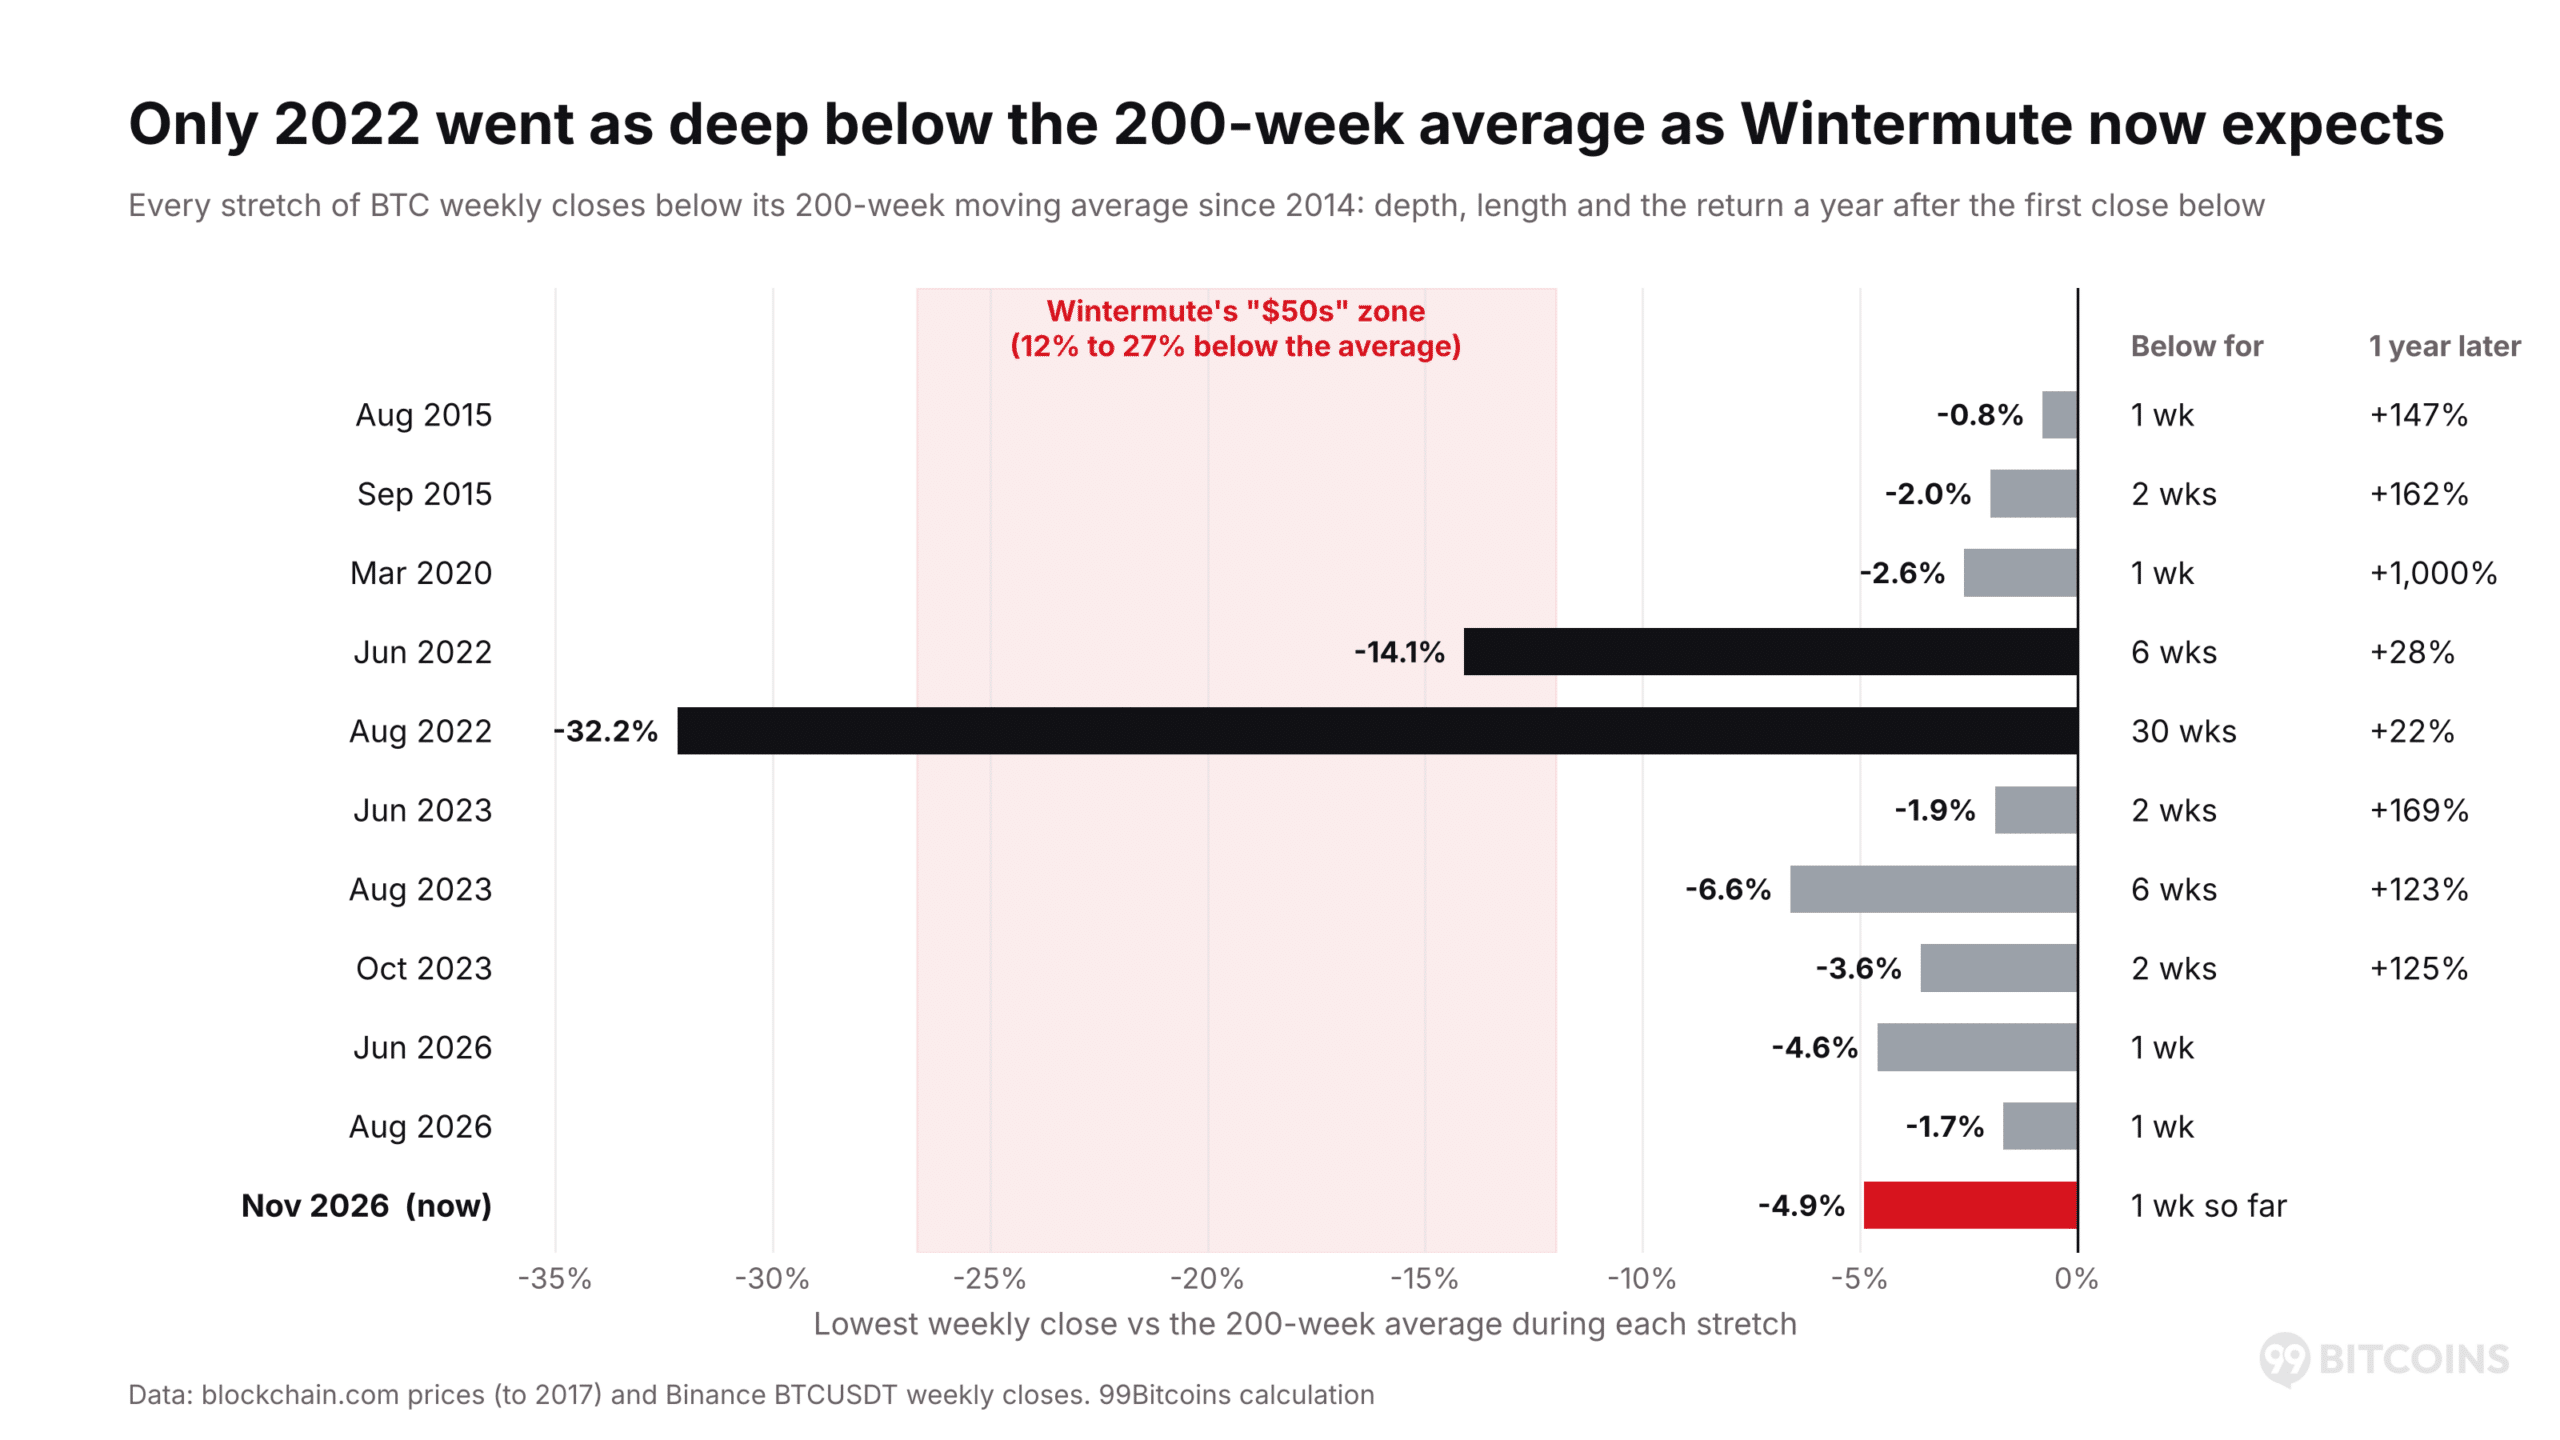
A review of every week since 2014 found that BTC USD had previously fallen below the average ten times. Seven of those periods lasted two weeks or less. Only the 2022 bear market declined as far as the $50,000 range identified by Wintermute as a possible target.
River reported that Bitcoin has spent 8.4% of its lifetime below the 200-week moving average. It calculated average returns of 120% one year later and 582% three years later for Bitcoin purchased during those periods.
Wintermute Warns That “The ETF Bid Is Gone”
In its November 16 market update, Wintermute said, “We haven’t cleared the bear market yet.” The market maker described the rally from the July low as “a fake-out.” Bitcoin fell 12.7% last week, while the S&P 500 gained 2.5%.
Wintermute based its assessment on several money-flow indicators:
- Exchange-traded funds: U.S. spot Bitcoin exchange-traded funds (ETFs), which hold Bitcoin directly and trade on stock exchanges, were approximately $1.9 billion net negative for 2026, following $21 billion of inflows in 2025.
- Stablecoins: Stablecoin supply — a figure watched as a gauge of dollar capital entering the market — declined by between $14 billion and $16 billion over 30 days, suggesting that “no fresh dollars are arriving.” Data from DefiLlama, an on-chain analytics platform, showed a $16.1 billion decline to $288.2 billion.
- Interest rates: Markets priced in approximately a 92% probability of a December rate hike by the Federal Reserve, the U.S. central bank, while the 10-year Treasury yield closed at 5.15%. Wintermute said Bitcoin pays no yield and is therefore sold first under those conditions.
- Liquidations: Approximately $1.7 billion was liquidated during the 24 hours leading into Sunday — meaning exchanges force-closed leveraged positions whose losses exceeded their margin — with 80% of the liquidated positions being long bets. Wintermute interpreted the subsequent bounce as short covering, buying by traders closing out short positions, rather than new buying.
Wintermute identified Saturday’s $62,000 low as the first level to watch and described the $60,000 options cluster on Deribit, a major crypto options exchange, as “the next magnet.” It said it would become less defensive only if BTC USD closed a day above the 200-week average near $68,000. Net ETF inflows on that same day would be its second required condition.
The market maker also included a caveat, saying that closes below the 200-week average “remain interesting for patient, high-conviction capital on a multi-quarter view.”
Bitcoin’s Previous Periods Below the 200-Week Average
River’s analysis put Bitcoin’s time below the 200-week average at 8.4% of its lifetime, with average returns of 120% after one year and 582% after three years. A separate count of weekly closes since the average first became available in 2014 produced a figure of 8.3%.
Most previous declines below the line were brief. Seven of the ten earlier stretches lasted one or two weeks, and none of those periods took Bitcoin more than 5% below the average.
The exception was 2022. Bitcoin entered two separate periods below the average that year, and the second lasted 30 weeks. Following the collapse of FTX, Bitcoin fell as much as 32% below the 200-week average.
In the eight cases with a full year of subsequent data, BTC USD was higher one year after its first weekly close below the line. The gains ranged from 22% after the 2022 period to 1,000% after the March 2020 crash.
In the current year, Bitcoin moved below the average for one week in late June and again in August, recovering on both occasions. Wintermute’s projected move into the $50,000s would distinguish the current period from those recent declines. Reaching that range would mean trading between 12% and 27% below the average. Over the past 12 years, only 2022 produced a decline of that depth.
The 200-Week Average Becomes Resistance
On the weekly chart, where each candle represents one week, BTC USD traded at $64,419. That price was below the 200-week simple moving average (SMA) at $68,191 and the 50-week SMA at $74,516. The 200-week SMA is calculated as the average of the previous 200 weekly closes.
The first resistance level was $68,191, corresponding to the 200-week average. Above that, $75,000 has repeatedly turned Bitcoin lower since March 2024, most recently in September.
The first support level was $61,000, where the 2021 high coincided with this year’s February and November lows. Below that, $53,000 marked the area where the 2021 highs and 2024 lows converge, within Wintermute’s target zone.
BTCUSDT 1W chart. Source: TradingView
Historical data has favored Bitcoin purchases below the 200-week average, but that pattern has depended on declines remaining relatively short. The money-flow conditions identified by Wintermute more closely resemble those seen in 2022. A weekly close above $68,191 would provide evidence in favor of the historical pattern; until then, Wintermute’s warning remains in place.

