Bitcoin Steadies Above $80,800 With Bulls Eyeing $85,000 Ahead of U.S. Jobs Report
Key Takeaways
- •Bitcoin traded around $80,856 on Friday, up more than 4% for the week, and remains above its 50-day, 100-day, and 200-day exponential moving averages.
- •Ethereum closed above the $2,500 resistance level, and XRP held a cautiously bullish outlook after rebounding from key support.
- •The U.S. Nonfarm Payrolls report could influence Federal Reserve rate expectations, with strong data potentially pressuring crypto and weak data providing support.
- •Bitcoin's next major upside target is resistance near $85,000, with a broad support zone between roughly $69,700 and $72,500 from its key moving averages.
- •Bitcoin's daily RSI near 71 indicates overbought conditions, suggesting the rally may be extended even as MACD momentum remains positive.
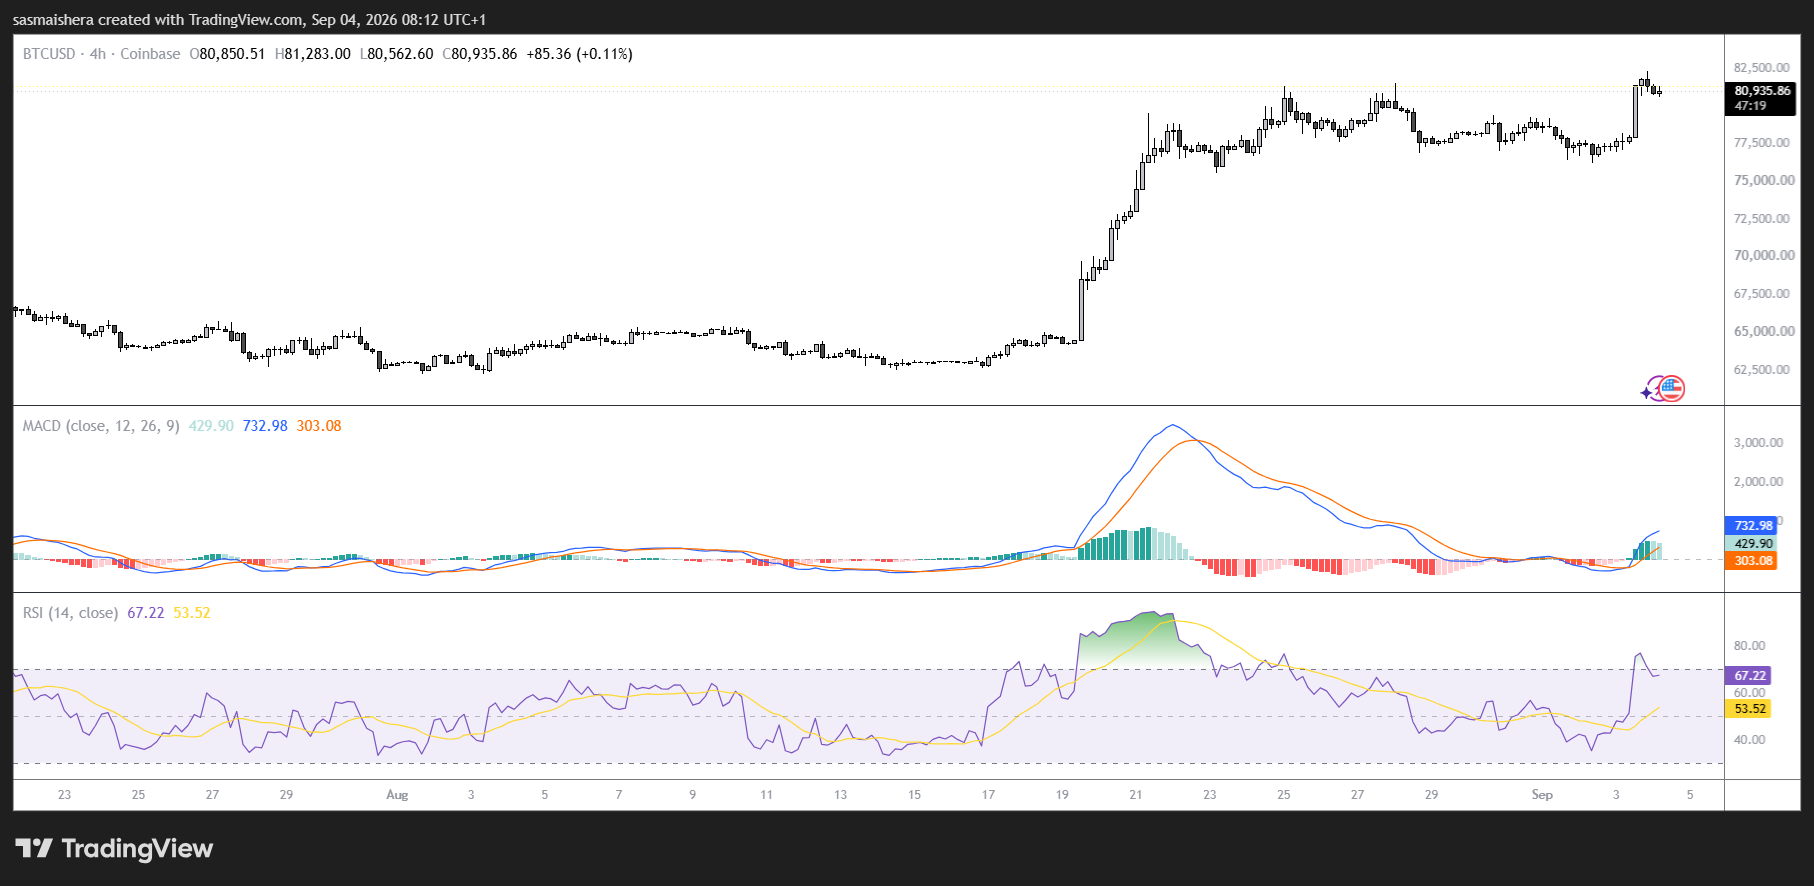
Bitcoin, Ethereum and XRP extended their weekly gains on Friday as traders awaited the U.S. Nonfarm Payrolls report, looking to it as the market's next directional catalyst.
Bitcoin traded above $80,800 after gaining more than 4% over the week. Ethereum also strengthened after breaking through and closing above the important $2,500 resistance level, while XRP maintained a cautiously bullish near-term outlook after rebounding from a key support level earlier in the week.
US jobs report could drive crypto volatility
The U.S. Nonfarm Payrolls report, released monthly by the Bureau of Labor Statistics, is one of the most closely watched gauges of U.S. economic health and could influence expectations for the Federal Reserve's next monetary policy decision. Digital assets have repeatedly shown sensitivity to shifts in rate expectations in recent years, as tighter monetary conditions tend to weigh on speculative assets while easing expectations have often coincided with crypto rallies.
A stronger-than-expected employment report may reinforce expectations that interest rates will remain elevated or rise further, potentially weighing on cryptocurrencies and other risk assets. Conversely, weaker employment data could reduce pressure on the Federal Reserve to maintain a hawkish position and provide additional support for Bitcoin, Ethereum and XRP.
Traders should therefore prepare for increased volatility as markets adjust their interest-rate expectations following the release.
Bitcoin maintains bullish structure above key EMAs
Bitcoin traded at approximately $80,856 on Friday and maintained a firmly bullish technical structure. BTC remains comfortably above its major exponential moving averages:
- The 50-day EMA at $71,126
- The 100-day EMA at $69,696
- The 200-day EMA at $72,539
The separation between Bitcoin's current price and these moving averages indicates that the broader uptrend remains well supported. However, the wide gap also leaves room for a correction if traders begin taking profits following the recent advance.
Bitcoin's Relative Strength Index stands near 71 on the daily chart. An RSI reading above 70 typically indicates that an asset has entered overbought territory. This does not guarantee an immediate reversal, but it suggests the rally may be becoming extended.
The Moving Average Convergence Divergence indicator remains in positive territory, signaling that bullish momentum continues. Momentum, however, appears less aggressive than during the earlier stage of the rally, which suggests buyers may be losing some strength as Bitcoin approaches resistance.
$85,000 in focus
Horizontal resistance near $85,000 represents Bitcoin's next major upside target. Fresh selling pressure could emerge around this level as traders take profits and previously sidelined sellers enter the market.
A decisive daily close above $85,000 would signal that buyers remain in control and could open the door to further gains. Failure to clear the level may lead to consolidation or a short-term pullback as the market absorbs Bitcoin's rapid advance.
Support structure below
Bitcoin's first major demand area is formed by its three key moving averages. The 200-day EMA at $72,539 provides the highest level of dynamic support, followed by the 50-day EMA at $71,126 and the 100-day EMA at $69,696. Together, these create a broad support zone between approximately $69,700 and $72,500.
If Bitcoin falls below all three averages, the next horizontal support levels sit at $66,500 and $62,300. A breakdown beneath those deeper levels would significantly weaken the broader bullish structure.
For now, Bitcoin remains firmly positioned above support as traders focus on a potential test of $85,000.
Source: CoinJournal
