Bitcoin Passes $87,000: Roughly $575 Million in Short Leverage Builds Near $90,000
Key Takeaways
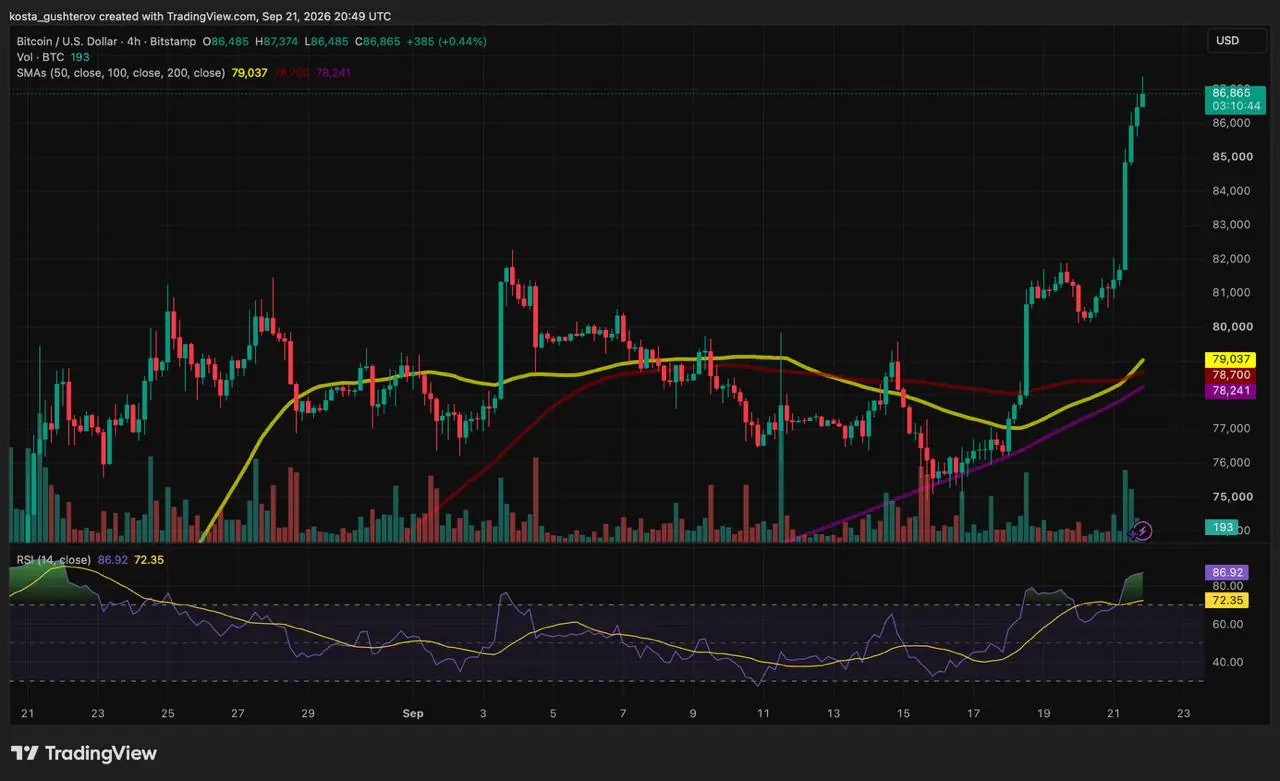
- •Bitcoin’s move above $87,000 extended its breakout from the May 2026 swing high near $82,800.
- •CoinGlass estimated cumulative short-liquidation leverage at $244.84 million near $87,660 and $574.72 million near $90,278.
- •The approximately $575 million figure represents exposure accumulated across a range and is not a guaranteed amount liquidated at exactly $90,000.
- •Forced short closures could intensify an advance, but an initial rise driven by fresh buying is still required.
- •Bitcoin’s four-hour RSI was approximately 87, while continued spot demand will determine whether prices hold above $90,000.
The Short Answer
The closest CoinGlass reading captured above $90,000 sits at $90,278, where estimated cumulative short-liquidation leverage totals $574.72 million.
That figure does not mean exactly $575 million will be liquidated the moment Bitcoin touches $90,000. It reflects estimated exposure accumulated across the stretch from the map's $86,900 reference price to approximately $90,300.
Liquidation maps are among the dashboards traders consult during fast markets because they show where forced closures could cluster, which is why estimated leverage stacked just beneath a round-number level such as $90,000 draws attention as price approaches it.
Bitcoin Extended Its Break Above the May Peak
Bitcoin crossed $87,000 on September 21 and touched $87,374 on the Bitstamp BTC/USD four-hour chart. By 20:49 UTC, the price had eased back to roughly $86,865, leaving the market about 3.5% below $90,000.
The advance extended the breakout that began when Bitcoin cleared the May 2026 swing high near $82,800. An earlier examination of the move through $84,000 found that forced short closures likely added momentum once that prior resistance gave way. Bitcoin has added roughly another $3,000 since that first push above $84,000, and the latest question is whether the short exposure still positioned above the market can supply another burst of forced buying.
That framing matters for reading the move: forced positioning can shape the pace of an advance in ways spot flow alone would not.
Estimated Exposure Rises Sharply Above $87,600
When checked, the CoinGlass Bitcoin Exchange Liquidation Map was set to a 90-day window and displayed a reference price of $86,900. The slight gap versus the Bitstamp quote reflects timing and exchange pricing differences.
At $87,660, CoinGlass estimated cumulative short-liquidation leverage of $244.84 million. By $90,278, that figure had climbed to $574.72 million. Roughly $330 million—about 57%—of the cumulative estimate between $87,660 and $90,278, meaning the concentration becomes substantially larger during the final stretch of the approach to $90,000.
The shape reflects where the estimated liquidation prices of open short positions sit: higher-leverage entries carry thinner margin cushions, so their forced-closure levels typically sit closer to the prevailing price.
Notably, the captured CoinGlass data contains no reading at exactly $90,000. Describing the figure as "$575 million at $90,000" would therefore overstate the precision. The data supports a narrower conclusion: a move through $90,000 and toward $90,278 could expose approximately $575 million in cumulative short-liquidation leverage.
What Happens When a Short Is Liquidated?
A short trader is positioned for Bitcoin to fall. When price rises instead, the position loses money and its available margin shrinks. If the remaining collateral can no longer sustain the trade, the exchange may close it automatically.
Closing a short requires an offsetting buy in the futures or perpetual market. When many positions are closed during the same advance, those orders can push derivatives prices higher. If derivatives begin trading above spot, arbitrage traders may buy spot Bitcoin and sell futures to capture the spread, transmitting part of that pressure to the spot market.
This is how a short squeeze reinforces itself: rising prices force some shorts to close, those closures add buying pressure, and the resulting move reaches the liquidation levels of other traders.
The process still requires an initial price increase, however. Liquidations can accelerate an existing breakout, but they cannot pull Bitcoin toward $90,000 without fresh buying pressure appearing first.
Why $574.72 Million Is Not Guaranteed
What the Map Cannot Know in Advance
- Which traders will close voluntarily
- Who will add collateral before liquidation
- How many new positions will open
- How prices will differ across exchanges
- Whether Bitcoin will reach every displayed level
CoinGlass calculates potential liquidation zones from market data and assumed leverage levels. The resulting map is a risk estimate, not a live list of fixed liquidation orders.
The displayed exposure can change before Bitcoin reaches the relevant price. A trader may reduce a short, add margin, or reverse the position entirely. New shorts can also enter after the snapshot, raising the eventual total.
Tracking how the displayed totals evolve as price approaches the level is therefore a running check on whether the estimated exposure is actually still there.
"Cumulative" is an important qualifier here. The $574.72 million reading represents estimated exposure spread across the route toward $90,278—it is not a single block of shorts scheduled to close together at one price.
Momentum Could Accelerate—and Destabilize—the Move
Bitcoin's four-hour relative strength index reached approximately 87 on the four-hour chart. RSI measures how quickly price has moved, and readings above 70 are traditionally described as overbought. That does not require an immediate decline—Bitcoin can remain overbought during a strong trend—but it does indicate the advance is already stretched before price reaches the next large concentration of estimated liquidations.
A fast push through $90,000 could therefore produce two effects at once. Forced short closures may add speed to the breakout, while the elevated RSI leaves the market more exposed to profit-taking once that forced buying slows.
The First Reaction Above $90,000 Would Matter Most
The liquidation map explains why Bitcoin could move quickly toward and through $90,000. It does not show who would continue buying once the shorts were closed.
If spot demand remains strong, the market could absorb profit-taking and begin establishing support above $90,000. If demand fades after the liquidation-driven orders pass through, Bitcoin could briefly cross the level and then fall back below it.
The observable checkpoints from here are straightforward: whether spot buying persists once forced closures pass through, whether the four-hour RSI cools from its stretched reading, and whether Bitcoin spends time above $90,000 rather than merely passing through it.
Forced closures may help Bitcoin reach a new range. Whether it can hold there will depend on buyers choosing to enter—not traders whose positions leave them no choice.
This article is provided for informational purposes only and does not constitute financial or investment advice. Cryptocurrency prices, leverage, and estimated liquidation levels can change rapidly.

