Bitcoin Faces $72,850 Liquidation Cluster as CPI and PPI Approach
Key Takeaways
- •Bitcoin traded at $73,976.11 according to CoinGecko, representing drops of 2.13% over 24 hours and 5.00% over seven days.
- •CoinAnk's three-day liquidation heatmap identifies the strongest downside cluster at $72,850-$73,250, carrying a maximum relative strength score of 100 and peak intensity of 289.58 million, about 1.60% below a snapshot price near $74,500.
- •Overhead liquidation zones flagged by CoinAnk span $76,250-$76,550 with a score of 81 and $76,850-$77,200 with a score of 95, plus a further layer near $78,350-$78,600.
- •Analyst Daan Crypto Trades named $75,000 and $77,000 as key local levels where a break could produce a rapid 5% move, with $72,000-$73,000 below and $80,000 above framing the broader range.
- •This week's macro calendar includes October CPI and core CPI on Tuesday and PPI data on Friday, arriving after a jobs report that added 165,000 positions, lifted unemployment to 4.1%, and pushed December rate-hike odds to 77-80%.
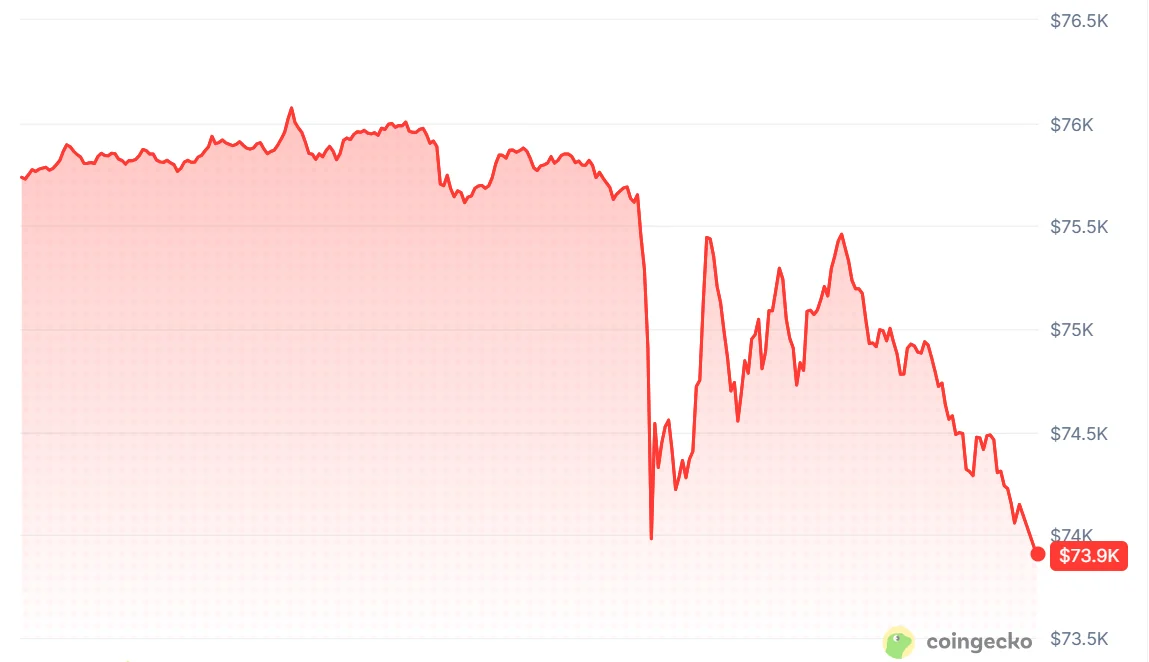
Bitcoin is trading near $74,000 as traders monitor a major liquidation cluster below the market. CoinGecko’s latest data puts Bitcoin at $73,976.11, down 2.13% over 24 hours and 5.00% over seven days.
CoinAnk’s three-day BTC liquidation heatmap identifies its strongest nearby lower zone between $72,850 and $73,250. The area has a relative strength score of 100 out of 100, while peak heatmap intensity reaches 289.58 million. Above the market, CoinAnk shows liquidation zones at76,250-$76,550 and $76,850-$77,200, with scores of 81 and 95, respectively.
Bitcoin Sits Between Major Liquidation Zones
CoinAnk’s snapshot showed Bitcoin near $74,500 after the price retreated from the mid-$76,000 range. Its Liquidation Radar displayed four signals, with all 20 alerts active. The strongest lower liquidity pocket was approximately 1.60% below the snapshot price.
The nearest overhead zone spans $76,250-$76,550, or 2.43% above the reference price, and carries a strength score of 81. A second cluster at $76,850-$77,200 is 3.24% away and has a score of 95. Another layer appears at $78,350-$78,600, approximately 5.25% above the reference price.
CoinAnk described the setup in a post on X:
$BTC NEAR $74.5K. MAX-STRENGTH ZONE SITS 1.60% BELOW. 3-day BTC liquidation heatmap. Price dropped from the mid-76k range and is consolidating. Liquidation Radar shows 4 signals, 20/20 alerts active.Strongest lower zone: $72,850 – $73,250, distance 1.60%, relative strength… pic.twitter.com/1uSG5WjI2b — CoinAnk (@CoinAnk) November 9, 2026
The post is also available through CoinAnk’s X post and the associated t.co link.
Liquidation heatmaps estimate where leveraged traders’ forced closures may be concentrated when prices move against their positions. They do not guarantee that Bitcoin will reach those levels or reverse there. If BTC enters a dense long-liquidation zone, forced selling may add pressure to a decline. A move into short-liquidation clusters can trigger buy orders as bearish positions are closed. Either process can accelerate price movements when liquidity is thin.
Daan Crypto Trades identified $75,000 and $77,000 as important local levels on X and said a break of either could produce a rapid move of 5%. The analyst also pointed to the $72,000-$73,000 area below and $80,000 above as broader levels. Daan’s comments are available in the analyst’s X post.
CPI and PPI Add to This Week’s Focus
The US economic calendar could influence whether traders test nearby liquidation clusters this week. October CPI and core CPI are scheduled for Tuesday at 8:30 a.m. Eastern Time, while Producer Price Index data and core PPI are due Friday. CPI measures changes in the prices consumers pay for goods and services, while PPI captures prices received by domestic producers for their output, giving traders two complementary readouts on inflation from different points in the economy.
The calendar also includes jobless claims, housing data, an OPEC report, and appearances by 17 Federal Reserve speakers, leaving markets several additional macro datapoints to process between the two inflation prints. Sweep’s post on X highlighted a planned $3.65 billion Federal Reserve injection on Monday. The US Treasury is scheduled to buy back $750 million of its own debt on Wednesday.
Sweep wrote:
MASSIVE WEEK COMING FOR CRYPTO HOLDERS Monday: Fed will inject $3.65 Billion into the economy Tuesday: US CPI and Core CPI data will be released Wednesday: Treasury will buy back $750 Million of its own debt Thursday: US housing data, 3 Fed officials will deliver speech… — Sweep (@0xSweep) November 8, 2026
The post is available in Sweep’s X post.
Inflation and labor-market data can shift expectations for interest rates. A stronger reading may reinforce expectations that borrowing costs remain elevated, while softer figures could support the opposite view. Markets may respond differently across asset classes.
A strong October jobs report added 165,000 jobs and pushed unemployment to 4.1%. The report lifted December rate-hike odds to between 77% and 80%. Traders will compare the upcoming inflation figures with that labor-market signal.
For Bitcoin, the immediate levels in focus are whether the price can recover $75,000 or instead moves toward the lower liquidity pocket. Daan’s levels frame a broader range, while this week’s economic releases could affect how quickly traders test either side. CoinGecko’s Bitcoin data is available here. The original report was published by Blockonomi.

