Bitcoin Price Prediction: $67K Barrier Stands Between BTC and $70K
Key Takeaways
- •Bitcoin is consolidating near $64,800, facing immediate overhead resistance at the $67,000 threshold.
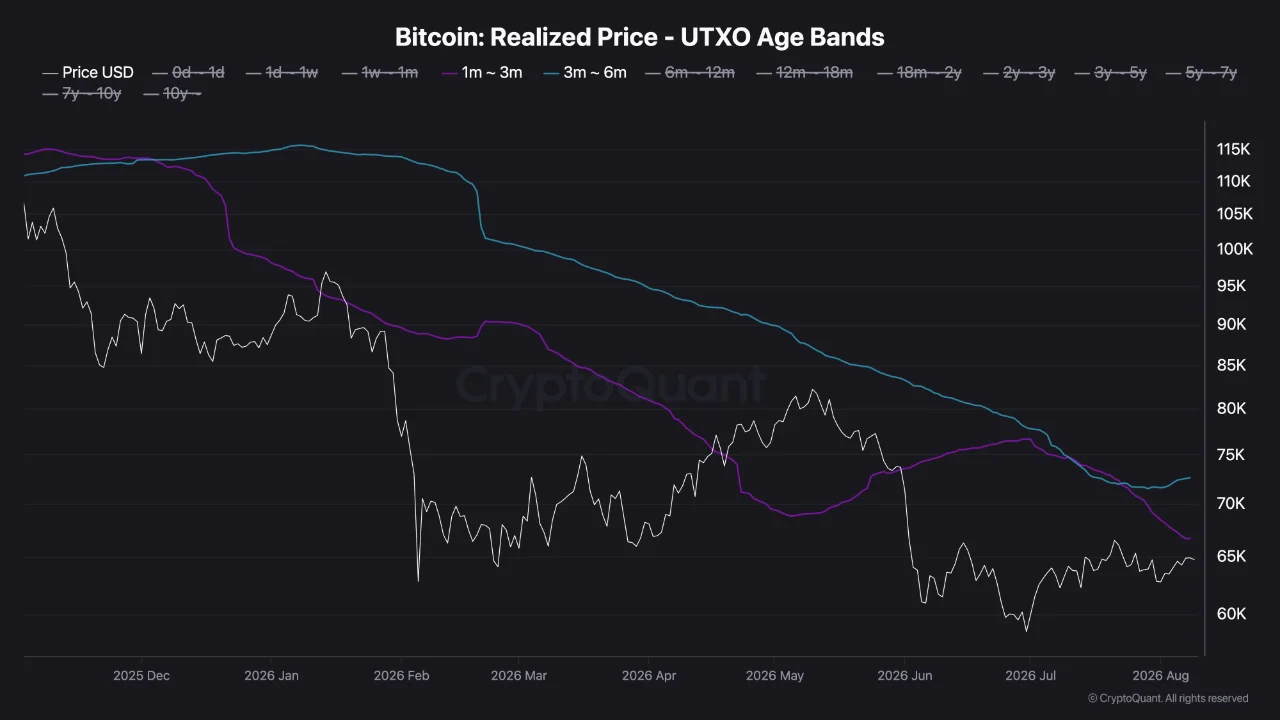
- •CryptoQuant data indicates that the cost basis for one-to-six-month holder cohorts creates supply zones between $67,000 and $72,000.
- •U.S. spot Bitcoin ETFs recorded consistent net inflows led by BlackRock's IBIT, though this demand has not catalyzed a definitive price breakout.
- •Analysts emphasize that a weekly close above $70,000 is required to confirm a bullish trend reversal.
Bitcoin traded near $64,800 on August 9 as overhead resistance continued to constrain price action. The leading cryptocurrency's near-term trajectory depends on its ability to reclaim the $67,000 level before attempting a push toward $70,000. According to CoinMarketCap, Bitcoin's price hovered around $64,367 with a 24-hour trading volume of approximately $24 billion.
The market structure remains significant because Bitcoin is currently trapped below the cost bases of recent holders and broader overhead liquidity. A sustained recovery through these key levels could absorb the existing supply from underwater buyers. However, a failure to break through would likely keep the market confined within its established summer trading range—a pattern consistent with historically lighter liquidity during the Northern Hemisphere summer months, when institutional desks often reduce activity.
$67K Barrier and Technical Levels
Data from CoinGecko placed Bitcoin's seven-day trading range between $62,785 and $66,340. This range kept the spot price below the first major resistance levels identified across technical and on-chain metrics. The cryptocurrency also remains significantly below its October 2025 record high of over $126,000.
An August 9 TradingView chart showed Bitcoin consolidating around $64,764 on the Bitstamp exchange. The price remained beneath a rising resistance line near $67,000, while lower structural support was established around $59,595. The chart also mapped intermediate resistance levels near $68,000, $72,000, and $76,000, with higher technical projection lines extending toward the low-$90,000 area. These marks serve as technical references rather than confirmed price objectives.
The ongoing price compression has narrowed the immediate decision zone. A breakout above nearby resistance could expose higher liquidity and retracement levels, whereas a failed push would leave Bitcoin vulnerable to another test of lower support.
Cost-Basis Resistance and On-Chain Data
CryptoQuant's Realized Price UTXO Age Bands, which measure holder cost bases by coin age, provide further context on overhead supply. The dataset placed the cost basis for the one-to-three-month holder cohort near $67,000, while the three-to-six-month cohort sat around $72,000. CryptoQuant's methodology values each unspent transaction output at its last movement price. The resulting realized-price bands approximate average acquisition costs for different holder groups. They do not predict timing, but they can identify likely supply zones.
Market analyst ShayanMarkets interpreted both cohorts as potential overhead supply zones. Recent buyers remain underwater while spot trades below their realized prices. A move toward these levels could invite selling from holders seeking breakeven exits. This dynamic makes the lower cohort the primary hurdle for the recovery attempt. Reclaiming the upper band would demonstrate stronger absorption of recent-holder supply. Until then, the technical setup remains constrained by these cost-basis levels.
ETF Demand and Market Structure
On the demand side, SoSoValue data indicated that U.S. spot Bitcoin exchange-traded funds (ETFs) maintained positive flows through August 7. The funds recorded approximately $98.8 million in net inflows during that session, with BlackRock's iShares Bitcoin Trust (IBIT) leading the inflows at roughly $86.7 million. BlackRock states that IBIT seeks to reflect Bitcoin's price performance through an exchange-traded product.
According to BlackRock's fund page, IBIT's net asset value stood at $36.74 on August 7, marking a 0.78% increase for the day. The five-session inflow streak provided a demand buffer during the market's consolidation. Fidelity's Wise Origin Bitcoin Fund (FBTC) also remained part of the regulated demand channel. Fidelity describes FBTC as a product that tracks Bitcoin through its reference rate, giving investors direct price exposure without holding the cryptocurrency themselves. These ETFs, first approved by U.S. regulators in January 2024, opened a regulated pathway for institutional and retail exposure to Bitcoin without self-custody, and their flow trends have since become a widely tracked demand signal.
Despite the consistent ETF inflows, spot prices failed to clear nearby cost-basis barriers. That gap suggests that ETF demand supported absorption without producing a confirmed breakout.
Weekly Close and Derivatives Positioning
Market commentators are closely watching Bitcoin's weekly structure. Analyst Daan Crypto Trades noted that Bitcoin was closing another weekly candle near its 200-week moving average, highlighting tightening space around the bull-market support band. The 200-week moving average is one of the most widely followed long-term trend indicators in Bitcoin technical analysis, often referenced as a dividing line between macro bull and bear phases. He identified $70,000 as the critical level that bulls need to break to confirm upward momentum. Separately, Crypto Rover pointed to a large liquidity cluster above the current price. Crypto King described a similar setup, expecting faster movement once the price enters that zone. Both analysts framed the overhead liquidity as the next short-term market test.
CME Group data showed active trading in August Bitcoin futures leading into August 9, with options strikes centered around the $64,000 area. This positioning keeps derivatives attention close to the spot price rather than far above resistance, leaving the current range sensitive to forced positioning near resistance levels. Liquidity above spot can accelerate movement, but it cannot establish direction before the price enters the zone.
The technical picture remains conditional rather than directional. A weekly close above $70,000 would strengthen the recovery structure, while a rejection below $67,000 would preserve the existing range and overhead supply. The next verifiable test comes with Bitcoin's weekly close on August 9. Traders will watch the $67,000 level first, followed by $70,000. Conversely, losing the $59,595 support area would weaken the current recovery structure.

