Bitcoin Bottom Signal Reemerges as BTC Trades Near $64,000 Amid Mixed On-Chain Indicators
Key Takeaways
- •Bitcoin traded near $63,850 on August 5, approximately 49% below its October 2025 record high of nearly $126,080.
- •Analysts identified $67,000 as the key breakout level needed to shift the daily chart structure in favor of buyers, while $60,000 serves as decisive range support.
- •Coinbase experienced unusually high netflows, with inflows of coins dormant for five to seven years surging over 1,000% relative to the quarterly baseline.
- •A negative Coinbase Premium between minus 0.04 and minus 0.14 indicated limited dollar-based buying pressure from U.S. market participants throughout the observed period.
- •CFTC-regulated prediction platform Kalshi showed contract pricing reflecting a 50% probability that Bitcoin would drop to $50,000 before returning to $100,000.
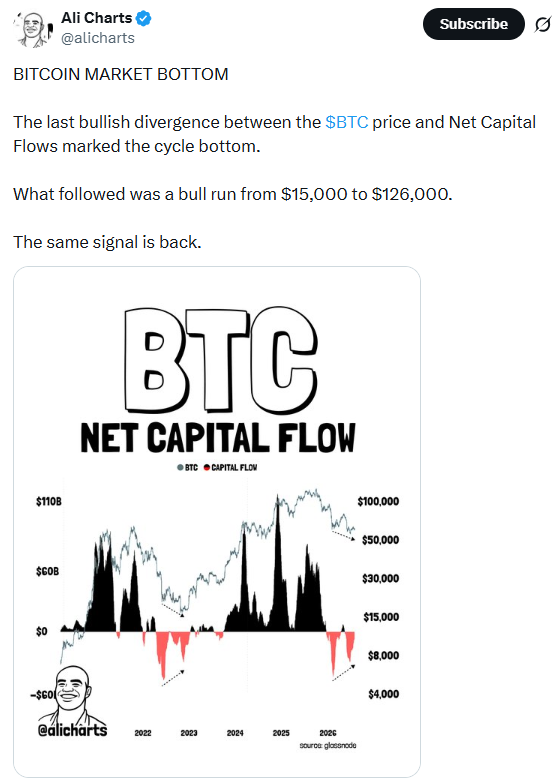
Bitcoin traded near $64,000 on August 5 as market participants weighed a renewed bottom signal against weakening spot demand. Analyst Ali Martinez linked the signal to a bullish divergence between Bitcoin's price and its net capital flows — a pattern he said previously coincided with the cycle bottom near $15,000 before Bitcoin ultimately climbed toward its record high. Net capital flows track whether funds are entering or leaving the Bitcoin network relative to price; when price declines but capital flows improve, it can suggest underlying accumulation despite falling spot values.
However, the divergence indicator alone did not confirm another bottom or provide a timeline for recovery. Bitcoin remained below the levels needed to repair its daily chart structure, and several on-chain metrics complicated the bullish case.
Price Action and Market Context
CoinGecko data placed Bitcoin near $63,850, with a 24-hour range of $62,785 to $64,960. Trading volume reached approximately $26.02 billion, and market capitalization stood near $1.28 trillion.
The price sat roughly 49% below its October 6, 2025 record of nearly $126,080, leaving the market exposed to competing interpretations of the latest capital-flow divergence. Large drawdowns from cycle peaks have historically preceded both extended bear markets and prolonged consolidation phases, meaning the divergence alone cannot distinguish between a temporary floor and a longer-range environment.
Traders Identify Key Structure Levels
Analyst Daan Crypto Trades pinpointed $67,000 as the June and July high, noting that a breakout above this level would create a higher high on the daily chart and shift the structure in favor of buyers. Until such a breakout occurs, Bitcoin remains confined within a broad range rather than a confirmed uptrend.
Ted Pillows placed immediate resistance near $65,000, with a secondary target around $70,000. He cautioned that rejection at current levels could push the price back toward lower support zones.
Both traders identified $60,000 as the broader range floor. A sustained break below that threshold would undermine the bottom thesis and expose February's lows.
Killa projected a potential move above $80,000 upon completion of a bottoming formation, basing his outlook on wave structure, trader psychology, and perceived market-maker behavior. These methods rely on subjective chart interpretation and carry no fixed timeline, meaning price confirmation carries more weight than the projected target.
Prediction-market data offered a contrasting perspective. Kalshi, a CFTC-regulated event contract platform where prices reflect crowd probability estimates, showed pricing cited by Ted that reflected a 50% probability Bitcoin would fall to $50,000 before returning to $100,000. Such probabilities represent contract positioning rather than confirmed outcomes and can shift rapidly with changes in liquidity, sentiment, and Bitcoin's price.
Dormant-Coin Inflows Concentrate on Coinbase
CryptoQuant contributor CryptoOnchain reported unusually high Coinbase netflows during the reviewed period. Netflows surged approximately 838% above their 30-day average and stood nearly 29,760% above the three-month baseline, though the author acknowledged a low comparison base.
Inflows of coins dormant for five to seven years rose above 1,000% relative to the quarterly baseline. Spending from three-to-five-year wallets increased nearly 600% week over week, with CryptoOnchain valuing the realized movement from that cohort at approximately $367 million. Movements of coins inactive for multiple years are widely monitored because long-term holders reactivating old wallets may be positioning to sell, though on-chain data alone does not confirm execution or intent.
CryptoQuant defines exchange netflow as inflows minus outflows from identified exchange wallets. Positive readings can indicate that more idle coins are becoming available for trading. Because CryptoQuant's exchange clusters receive periodic updates as new wallets are identified, the platform cautions that recent and historical flow readings may be revised.
Binance exhibited less consistent movement over the same 14-day window. Its netflow swung from a 5,124 BTC outflow to a 3,289 BTC inflow, suggesting that older-coin activity was concentrated on Coinbase rather than across all major exchanges. This did not, however, prove that holders intended immediate sales.
Weak U.S. Spot Demand Reflected in Premium Data
CryptoOnchain reported a negative Coinbase Premium ranging between minus 0.04 and minus 0.14, with no positive reading recorded during the observed period. CryptoQuant uses the Coinbase Premium to compare Coinbase's U.S. dollar market with Binance's Tether market; a weak premium can signal limited buying pressure from Coinbase participants. Because Coinbase is one of the largest U.S.-regulated exchanges and a primary venue for dollar-based trading, the premium is widely followed as a proxy for American institutional and retail demand.
The Network Value to Transactions Golden Cross also declined sharply from an earlier undervaluation reading, with CryptoOnchain reporting drops exceeding 300% weekly and 1,200% against the quarterly baseline. The NVT ratio compares Bitcoin's market valuation to its on-chain transaction volume, serving as a rough gauge of whether the network is overvalued or undervalued relative to actual usage.
Funding rates on Binance remained near zero to 0.01 during the period. According to Binance, positive funding requires longs to pay shorts, while negative funding reverses that payment direction. Near-zero funding suggested restrained leveraged positioning rather than crowded bullish exposure — a condition that reduced immediate liquidation pressure but provided little evidence of strong demand.
Bitcoin's next verifiable test remains the $65,000 resistance area, followed by $67,000. A daily close above the latter would lend support to the bottom signal thesis, while $60,000 stands as decisive support.

