Arbitrum Price Analysis: ARB Retests September Breakout Zone as Iran Risk Weighs on Crypto Markets
Key Takeaways
- •Arbitrum is defending the $0.205–$0.208 zone, a former resistance shelf from its September advance that coincides with a rising trendline on the daily chart.
- •A daily close above $0.212, the 23.6% Fibonacci retracement, would show buyers regaining the former breakout area, while continued trading below $0.205 would shift attention to the 38.2% retracement near $0.185.
- •The broader crypto pullback reflects renewed uncertainty over the Strait of Hormuz, where rising oil prices can sustain inflation concerns and elevated bond yields.
- •ARB's relative strength index has moved out of overbought territory, indicating cooled momentum even as the broader September structure remains constructive.
- •Standard Chartered's reported forecast targets $0.50 for ARB by the end of 2026 and $10 by the end of 2030, an outlook dependent on tokenized-asset growth, institutional adoption, and ecosystem revenue.
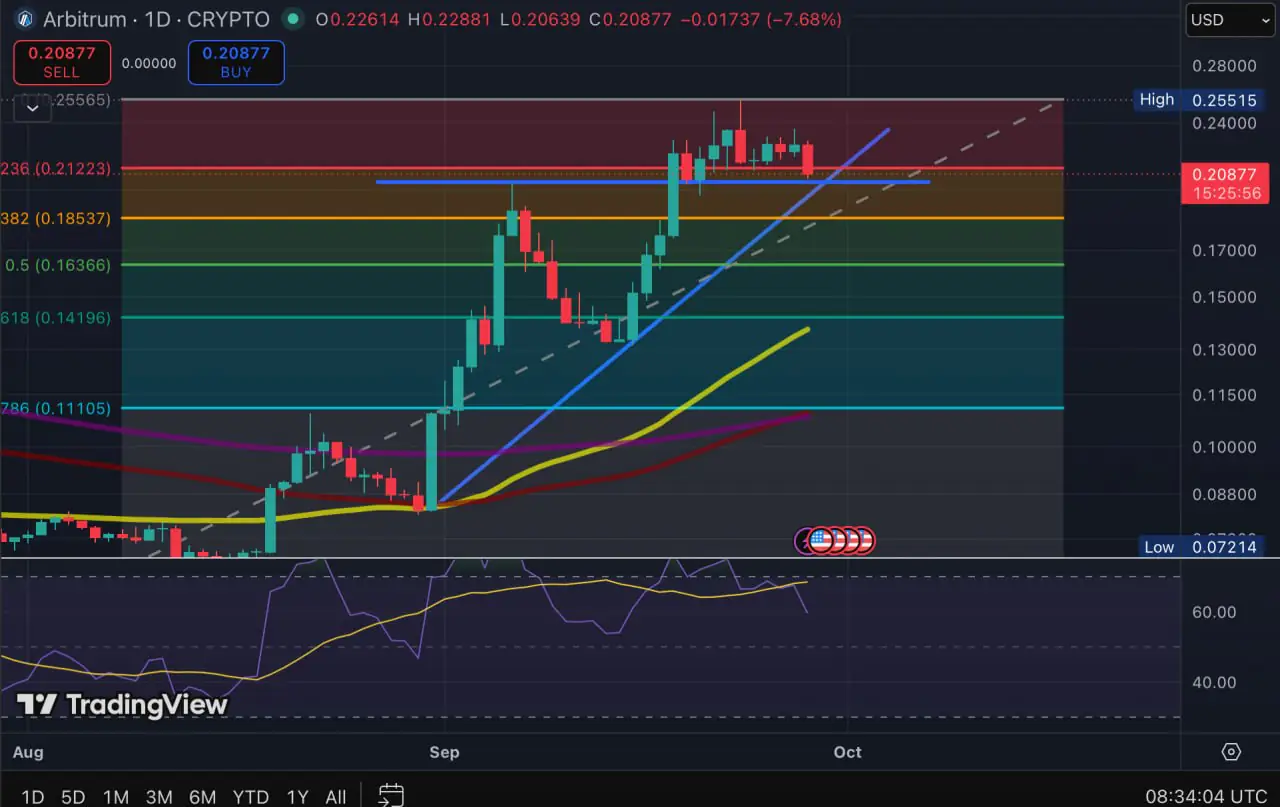
Arbitrum (ARB), the token of the Ethereum layer-2 scaling network of the same name, is retesting the $0.205–$0.208 zone that capped its September advance before price broke higher, turning the former resistance shelf into the market's nearest test of support. The area coincides with a rising diagonal trendline on the daily chart, giving buyers a clearly defined level to defend as renewed geopolitical risk weighs on the wider crypto market.
The token is also trading just below the 23.6% Fibonacci retracement near $0.212, the first recovery level to watch, while the 38.2% retracement near $0.185 becomes relevant below support. Bitcoin and other crypto assets have pulled back alongside ARB as traders reassess the outlook for the Strait of Hormuz, the narrow passage between Iran and the Arabian Peninsula that carries a large share of the world's shipped oil, where fresh uncertainty has returned oil, inflation and interest rates to the market's attention.
Fibonacci Levels Frame the Recovery Path
Fibonacci retracements plot potential support and resistance at fixed percentages of a prior price move. A daily close back above $0.212 would show that buyers have regained the upper part of the former breakout area after the latest decline. A wick below the diagonal, by itself, would not settle the chart. Continued daily trading below the $0.205–$0.208 range, however, would weaken the recent structure and shift attention toward the 38.2% Fibonacci retracement near $0.185.
The chart, in other words, shows what ARB needs to defend. The broader market helps explain why that test has arrived now.
Renewed Iran Risk Returns Oil and Yields to Focus
Oil prices moved higher again after hopes for a rapid agreement between Washington and Tehran weakened. Higher energy prices can revive inflation concerns and keep bond yields elevated.
That backdrop can make volatile assets harder for investors to hold, particularly tokens that have already risen sharply in a short period. It offers context for a market-wide pullback without assigning ARB's entire daily decline to one geopolitical headline.
Cooling Momentum Leaves the Broader Structure Intact
ARB's relative strength index (RSI), a momentum gauge commonly read as overbought above a level of 70, has moved out of overbought territory after the recent advance. Momentum has cooled, which is consistent with a market working through a pullback, though the indicator cannot establish where that pullback will end.
The broader September structure remains constructive while the rising trendline and former breakout area continue to attract buyers. Holding the $0.205–$0.208 shelf and recovering $0.212 would keep the pullback contained within the recent advance. A sustained break lower would put the $0.185 area under focus and show that the rally needs more time to rebuild.
Macro conditions may explain the pressure, yet the daily close will determine whether the technical structure has held.
The Chart and Standard Chartered's Forecast Answer Different Questions
The daily chart can show whether ARB's latest rally is holding together. It cannot answer whether Arbitrum will meet the adoption assumptions behind a multi-year bank forecast.
Standard Chartered's reported ARB outlook set a nearer-term $0.50 target the end of 2026 and a $10 target for the end of 2030. From roughly $0.209, the first target would require an advance of about 140%. The $10 forecast implies a rise of roughly 4,680%.
The bank's view depends on tokenized-asset growth, institutional use of Arbitrum technology and whether ecosystem revenue eventually creates sustained demand for ARB. A daily support test neither confirms nor invalidates those assumptions.
The $0.50 target is the more practical checkpoint for now. It sits far closer than $10 and gives readers a point where stronger price action could later be compared with evidence of adoption and ecosystem revenue.
The Next Daily Close Will Show Whether Support Is Holding
ARB's immediate task is straightforward: buyers need to show that the September breakout shelf can still attract demand during a risk-off market. A recovery above $0.212 would strengthen that case, while continued weakness below $0.205 would place $0.185 in view.
The longer-term case will rely on different evidence over the coming years: institutional adoption, durable ecosystem revenue and a clearer connection between that activity and ARB demand. The current decline cannot settle those questions, though it can show how resilient the September rally is under pressure.
This article is provided for informational purposes only and does not constitute financial or investment advice. Cryptocurrency prices are volatile, and technical levels can change quickly.

