Arbitrum Price Clings to $0.16 as Half the Rally Is Retraced
Key Takeaways
- •ARB trades near $0.16 on Binance, down 3.13% on the day and roughly 36% below its recent peak of about $0.26, having given back half of the advance from around $0.07.
- •The price is holding on the 50% Fibonacci retracement near $0.164, and an intraday dip below it was quickly reversed by buyers ahead of the daily close.
- •A cluster of broken supports—the rising trendline, the 50-day simple moving average near $0.19, and the 38.2% retracement near $0.185—now forms resistance about 13% above the current price.
- •The daily Relative Strength Index reads 40.34 and is still pointing lower, below both the 50 midline and its 47.80 signal line, signaling weak momentum that has not yet reached oversold territory.
- •Daily volume was 12.14 million ARB, roughly $2 million, while the ordering of the 50-day, 100-day, and 200-day moving averages remains consistent with a longer-term uptrend.
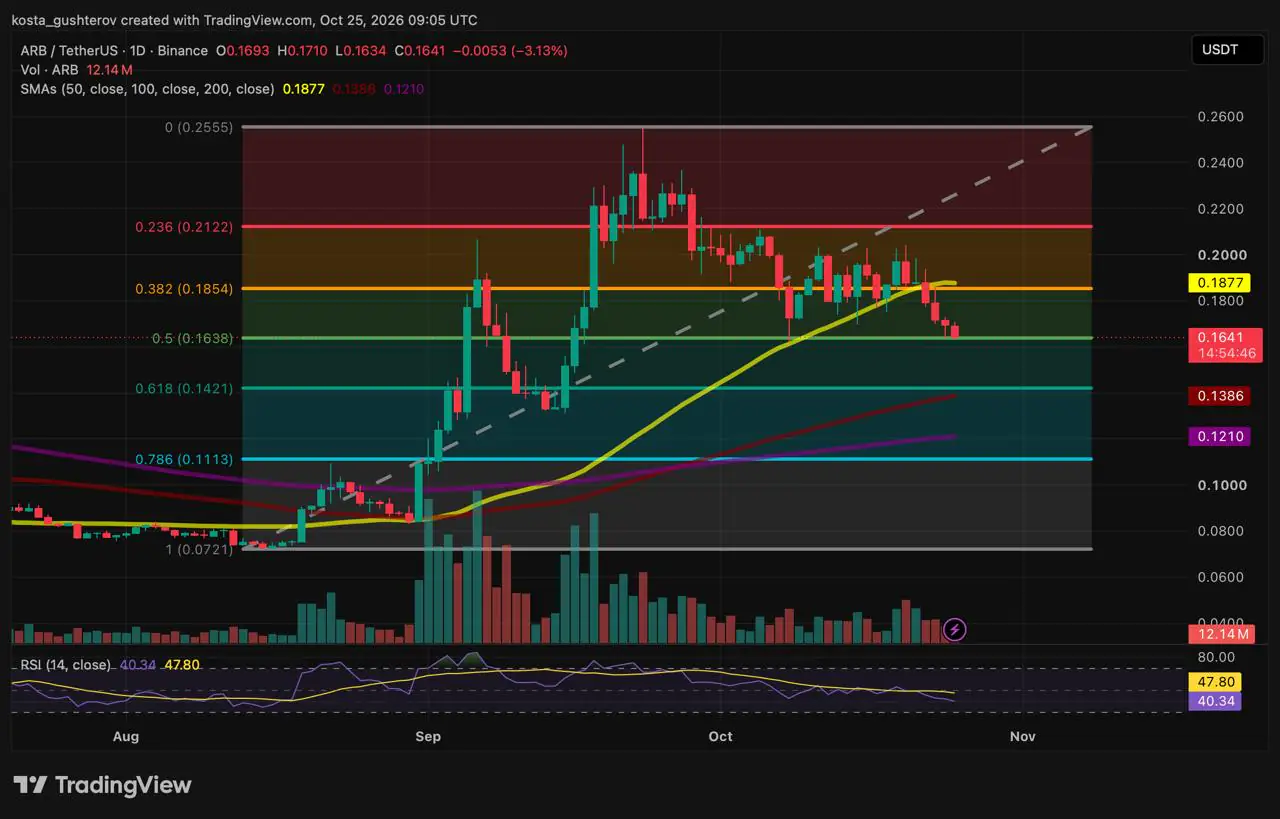
Arbitrum (ARB) is trading near $0.16 on Binance, down 3.13% on the day, with the price holding directly on 50% Fibonacci retracement of its latest advance. The intraday low briefly slipped below that level before buyers pushed the token back above it, leaving the session's outcome to depend on where the daily candle closes.
ARB is the governance token of Arbitrum, an Ethereum Layer-2 scaling network.
Half the Rally Retraced
The Fibonacci grid runs from the swing low near $0.07 to the recent peak near $0.26, placing the 50% retracement at roughly $0.164. Retracement levels of this kind are derived from ratios of the Fibonacci sequence and are standard reference points in technical analysis, which is why intraday behavior around the 50% midpoint is used to gauge how deep a pullback has run. ARB's intraday low dipped under it before creeping back above, indicating that initial buyers have stepped in.
Measured from the top, ARB is down about 36%. Against the entire run from $0.07, it has handed back half of the move. The two figures describe the same pullback from different starting points and, taken together, depict a deep correction within a rally that remains well above where it began.
Because the rally spanned approximately $0.18, each Fibonacci step represents a meaningful distance at the current price. The drop from the 50% line to the 61.8% level near $0.142 amounts to about two cents, or roughly 13% below where ARB trades now.
$0.19 Emerges as the Level to Reclaim
The sell-off pushed ARB below its rising trendline and beneath the 50-day simple moving average (SMA) near $0.19. The 38.2% retracement, located in the same zone, also gave way on the decline. With three references stacked in that area, $0.19 has shifted from support into the main ceiling.
That ceiling, with the 38.2% level near $0.185, sits about 13% above the current price — almost the same distance as the next support below. ARB is therefore trading roughly midway between its nearest resistance and nearest floor, which is why the daily close at the midpoint carries more weight than usual.
Recovering the moving average alone would not be enough, as the trendline keeps rising over time and would also need to be reclaimed. Above that, the 23.6% retracement near $0.21, where the breakdown began, is the next hurdle, with the $0.26 peak beyond it.
Momentum Has Not Turned
The daily Relative Strength Index (RSI) reads 40.34 and is still pointing lower, below both the 50 midline and its signal line at 47.80. That reading is weak but not oversold, with the conventional oversold threshold at 30. The first sign that selling pressure is easing would be the RSI turning upward and crossing back above its signal line — a moving average of the RSI itself — which remains more than seven points above it.
The moving averages present a more mixed picture. The 50-day sits near $0.19, above the 100-day near $0.14 and the 200-day near $0.12 — an ordering still consistent with a longer-term uptrend. The short-term damage is real, but the broader structure has not flipped. Daily volume stood at 12.14 million ARB, roughly $2 million at current prices.
Scenario Outlook
Upside: A daily close above the 50% level would keep the bounce alive, and a move toward $0.18 would extend it. The decisive test is the $0.19 cluster; reclaiming it, along with the trendline, would bring $0.21 into view.
Rejection: A clear daily close below the midpoint would undo the intraday recovery and put $0.14 in play, where the 61.8% retracement sits just above the 100-day SMA. Below that, the 200-day SMA near $0.12 and the 78.6% retracement near $0.11 come next.
Bigger picture: While ARB remains below the broken trendline and the 50-day average, bounces look like relief moves within a correction rather than the start of a new uptrend. Each lower level serves as a reference point, not a guaranteed floor.
This article is provided for informational purposes only and does not constitute financial or investment advice.
Source: Coindoo

