Arbitrum (ARB) Price Holds Near $0.20 After September's Surge Fades
Key Takeaways
- •ARB rose roughly 2.46% to trade near $0.205 on Bitstamp by 07:22 UTC on October 2, leaving it about 20% below its September wick high near $0.255.
- •The token's immediate outlook hinges on the $0.19–$0.20 zone, where a rising trendline through the late-August and September lows aligns with a prior horizontal ceiling.
- •Although ARB remains above all three simple moving averages, a drop to the first deeper support would represent an additional decline of roughly 27%–29% from $0.205.
- •The 14-period RSI stood near 57.7 after a bearish divergence during the September advance indicated weakening momentum behind the later price high.
- •Arbitrum reported September revenue of $5.45 million, with Orbit licensing fees accounting for $4.75 million — about 87% — supplemented by Priority Gas Auctions that send 97% of priority fees to the DAO treasury.
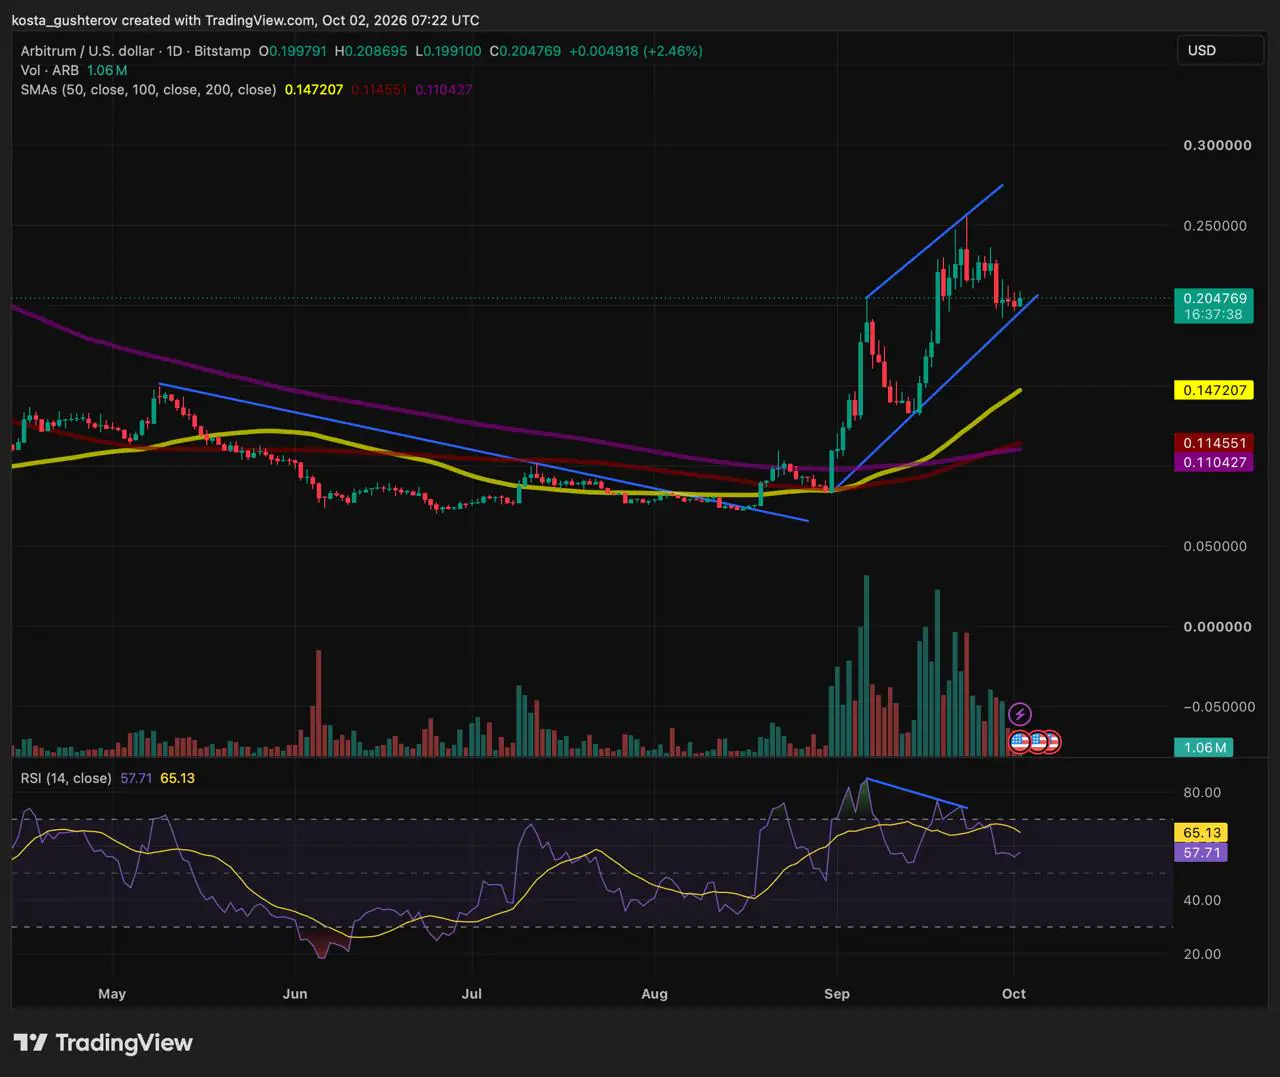
Arbitrum (ARB) was changing hands near $0.205 on Bitstamp at 07:22 UTC on October 2, up approximately 2.46% from the previous daily close. Arbitrum is a layer-2 scaling network for Ethereum, and ARB is the token used in its governance. With the session still open, the modest rebound left the token only slightly above a closely watched support band after several days of retreat — and roughly 20% below its September peak.
September's higher low remains intact
Through much of June, July and August, ARB traded in a range of roughly $0.073–$0.10 as selling pressure eased and a base took shape. Repeated recovery attempts stalled at the descending trendline connecting the May and July highs. The break above that line ahead of September's acceleration allowed the rebound to extend beyond the pattern of falling highs.
The first sharp advance was followed by a pullback toward $0.132, where buyers stepped back in above the late-August low. The next push carried ARB to a September wick high near $0.255. That sequence — a higher low followed by a higher high — established the recovery more clearly than the trendline break alone.
Although ARB has since surrendered ground, it remains well above that September low. The recent decline has dented the shorter-term trend without undoing the larger structure. The next support test sits along the rising trendline drawn through the late-August and September lows, which reaches approximately $0.19 at the current candle.
That diagonal lies near the earlier September peak, giving buyers two nearby chart references: the rising path of the recovery's lows and a horizontal zone that previously capped the advance. Both now fall within, or close to, the $0.19–$0.20 area.
The nearby support test matters more than distant moving averages
Price has already dipped into the horizontal zone and recovered, leaving lower wicks on recent candles. The October 2 candle reached roughly $0.1991 before moving higher, showing buyers responding near $0.20, while a completed retest of the rising trendline closer to $0.19 remains unconfirmed.
The key observation for anyone tracking the rebound is whether those recoveries hold. A wick records a rejected price within a single session; several sessions holding above support would offer stronger evidence of sustained buying. If each bounce instead peaks lower and pulls ARB back toward the same floor, the recovery would be struggling to regain ground.
Deeper references sit below the immediate test. ARB remains above all three simple moving averages, with the 50 SMA above the 100 SMA and the 200 SMA. Each SMA tracks daily closing prices over its stated period, so this alignment reflects the improvement since the summer base. Those averages describe the slower recovery, while the nearby support test shows whether buyers are still defending it today.
The distance to the first deeper area is substantial: a fall there would represent an additional decline of approximately 27%–29% from $0.205. Price could therefore stay above its longer averages while still suffering a sizable further loss. That gap makes the response around $0.19–$0.20 a more useful gauge of the immediate pullback than the fact that ARB still trades above its 50 SMA.
RSI cools within the recovery
Momentum has cooled more visibly. The 14-period relative strength index (RSI), which compares recent gains with losses, stood near 57.7 — below its smoothing line around 65.1 and well below September's overbought readings.
During the advance, ARB printed a higher closing-price high while the RSI reached a lower corresponding peak. That bearish divergence indicated the later price high carried weaker momentum behind it, adding a note of caution to the rally before the current retreat.
At 57.7, average gains still outweigh average losses under the indicator's calculation. Momentum has weakened without dropping below the indicator's midpoint, so the reading does not by itself establish a reversal. A sustained move below 50 alongside a break of price support would constitute a stronger warning than the divergence alone.
Licensing fees dominate Arbitrum's September income
While ARB's price has pulled back, the latest revenue reporting points to a stronger month for the network. BlockBeats reported September revenue of $5.45 million, including $4.75 million from Orbit licensing fees. Licensing accounted for approximately 87% of the reported total.
Orbit is Arbitrum's framework for dedicated chains, and under the Arbitrum Expansion Program businesses can use it to operate their own networks, with chains contributing a share of protocol net revenue. That gives Arbitrum an income stream tied to activity on those chains, alongside the fees generated on its own shared network.
The official Robinhood Chain factsheet sets out the split for chains launched under the program: 8% of protocol net revenue goes to the ArbitrumDAO treasury and 2% to the Developer Guild, together making up the program's 10% share. By way of illustration, $1 million of qualifying net protocol revenue would produce an $80,000 treasury contribution and $20,000 for the Guild. That example describes the agreement rather than a reported monthly payment, and because the calculation starts from net revenue, applying the same percentages to gross user fees would yield different figures.
Arbitrum has also launched Priority Gas Auctions, adding income from competition over transaction ordering. A trading application can attach a priority fee when earlier execution matters to it. Under the PGA rules, 97% of collected priority fees goes to the DAO treasury and 3% to the Developer Guild. Those fees supplement the far larger licensing contribution in September's reported breakdown.
ARB holders take part in governance decisions, but treasury income does not automatically translate into payments to each holder. Understanding how Arbitrum's revenue connects to ARB therefore requires looking at how those funds are used, including development and other approved spending. Recurring income could give the DAO more resources for such work.
September's total, however, leaves open how much licensing revenue will persist as activity on contributing chains changes. A large contribution concentrated in a single category can vary considerably between months. Tracking that breakdown over time would help market participants judge whether the treasury's stronger income is durable.
The next rebound needs to hold its gains
If the $0.19–$0.20 zone holds: recapturing the $0.22–$0.23 area and then maintaining it would show buyers reversing part of the recent decline and could strengthen the case for another attempt at the $0.245–$0.255 range.
If support breaks: a daily close below the rising trendline and roughly $0.19, followed by a failed reclaim, would weaken the immediate setup and bring the deeper support areas into view.
Losing nearby support would represent an earlier setback than breaking September's higher low around $0.13–$0.135. That lower area marks where buyers previously restarted the advance, so a subsequent loss there would do more damage to the broader recovery.
A rebound becomes more convincing when renewed selling fails to push price back below the ground buyers have recovered. That response would provide firmer evidence of demand than the first green candle after a decline.
This article is for informational purposes only and does not constitute investment advice. Technical levels are approximate and reflect the chart at the stated timestamp.

