Arbitrum Price Analysis: ARB Consolidates Between Rising Support and Descending Resistance
Key Takeaways
- •ARB, the governance token of Ethereum Layer-2 network Arbitrum, fell below its ascending parallel channel after a run of lower highs and lower lows, ending its multi-week rising structure.
- •The token was trading around $0.194, up roughly 6.6% on the day, after recovering above the $0.185 level that marks the 0.382 Fibonacci retracement of its move from about $0.07 to $0.25.
- •The rising 50-day simple moving average near $0.174 acts as the main dynamic support, while a descending trendline near $0.196-$0.198 continues to cap recovery attempts.
- •The 14-day RSI stands near 52 with its signal line around 51.5, indicating neither buyers nor sellers currently hold a decisive momentum advantage.
- •A decisive daily close above $0.196-$0.198 would put Fibonacci targets near $0.212 and $0.255 in focus, whereas a close below $0.174 could expose downside levels at $0.163 and $0.141.
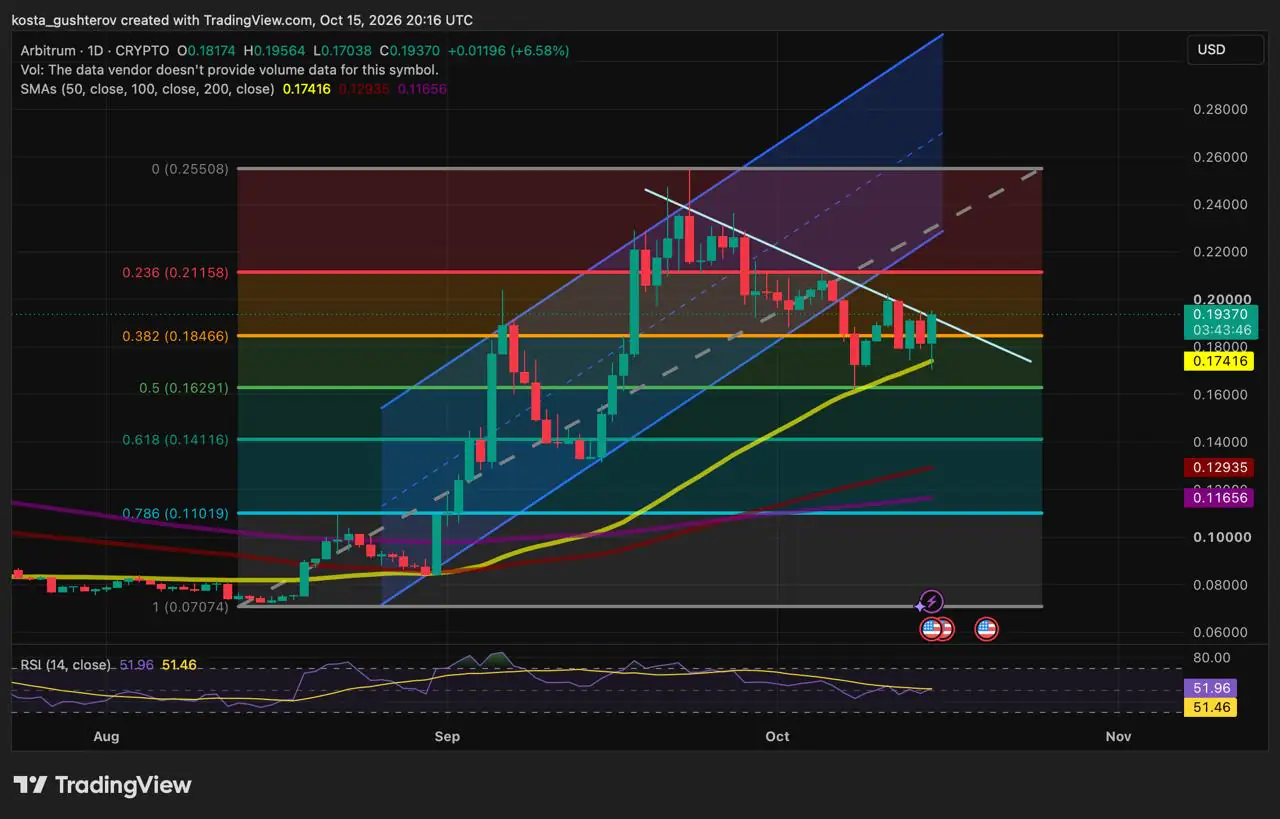
Arbitrum's ARB token has broken out of its ascending channel and is now consolidating in a narrow range bounded by rising moving-average support below and a descending trendline overhead, according to a Coindoo technical analysis published on Oct. 15. ARB is the governance token of Arbitrum, a Layer-2 scaling network built on Ethereum.
Channel breakdown ends multi-week rising structure
ARB had previously advanced within a clearly defined ascending parallel channel, a chart pattern that frames a steady uptrend between two upward-sloping parallel boundaries. A sequence of lower highs and lower lows subsequently pushed the price below the channel's lower boundary, ending the immediate multi-week rising structure.
Following the break, the token formed a descending resistance trendline connecting the swing high near $0.255 with progressively lower reaction highs through late September and October. That trendline now defines the local downtrend.
The most recent daily candle pushed toward the diagonal resistance near $0.196 but met selling pressure, leaving an upper wick. ARB was trading around $0.194 at the time of the analysis, up roughly 6.6% on the day, though the descending line continues to cap the recovery.
The 50-day SMA and $0.185 Fibonacci level frame the range
Beneath the price, the 50-day simple moving average (SMA) — a widely watched gauge of intermediate-term trend — sits near $0.174 and continues to slope upward. Recent wicks toward $0.170 found buying interest around this average, making it the main dynamic support beneath the current range.
The $0.185 level, which marks the 0.382 Fibonacci retracement of the move from approximately $0.07 to $0.25, now acts as the nearest short-term pivot. Fibonacci retracements are ratio-based levels that traders watch for potential reaction points after a strong directional move. ARB has recovered above it, placing the price in a narrow area between the rising 50-day SMA below and descending resistance overhead.
Within this range, buyers are defending the $0.174-$0.185 support area, while sellers have so far protected the descending trendline near $0.196-$0.198.
Neutral momentum leaves the breakout level in focus
The 14-day relative strength index (RSI), a momentum oscillator measured on a 0-100 scale that compares the pace of price gains to losses, stands near 52, while its signal line sits close to 51.5. Both readings hover around the 50 midline, indicating that neither buyers nor sellers currently hold a decisive momentum advantage.
That neutral position fits the price structure: ARB has rebounded from support but has not yet invalidated the descending trendline that followed the channel breakdown. Until either level breaks, the token remains in a tight consolidation range rather than a confirmed new trend.
What could confirm ARB's next move
Upside case: ARB breaks the descending trendline. A stronger recovery would require a decisive daily close above the descending resistance area around $0.196-$0.198. A confirmed break would invalidate the local downtrend and put the 0.236 Fibonacci level near $0.212 in focus. Above that level, the major swing high near $0.255 becomes the broader upside reference.
Downside case: the 50-day SMA gives way. For the bearish scenario, ARB would need to close below the 50-day SMA near $0.174. That would break the current consolidation range and expose the 0.500 Fibonacci level near $0.163. If selling continued, the 0.618 Fibonacci level near $0.141 would become the next major downside area.
Bottom line
ARB has reclaimed the $0.185 level but remains trapped between rising moving-average support and descending trendline resistance. A daily close above the $0.196-$0.198 zone, or a break below $0.174, may provide the clearer signal for the token's next direction.
This analysis is provided for informational purposes only and does not constitute financial or investment advice. Technical levels can change as market conditions develop.

