Arbitrum (ARB) Forms Bull Flag After Reclaiming $0.205 as Support
Key Takeaways
- •ARB was changing hands near $0.210 on September 20 while testing the $0.203–$0.206 band as support, an area that capped the token earlier in the month before price broke higher.
- •The chart shows a bull flag following an advance from about $0.13 to $0.228, with confirmation requiring a four-hour close above the descending boundary near $0.214–$0.216, ideally on rising volume.
- •If the flag fails, initial downside references sit at $0.200 and around $0.190, and the four-hour 50-period moving average near $0.170 leaves room for a sharper correction.
- •The four-hour RSI cooled to roughly 59 from overbought levels above 80, a possible hidden bullish divergence remains unconfirmed due to a wick below support, and ARB holds above its 50-, 100- and 200-period moving averages.
- •ARB has climbed around 53% since Standard Chartered's September 15 forecast of $0.50 by end-2026 and $10 by end-2030, targets dependent on institutional adoption even though the token offers no dividends or automatic buybacks.
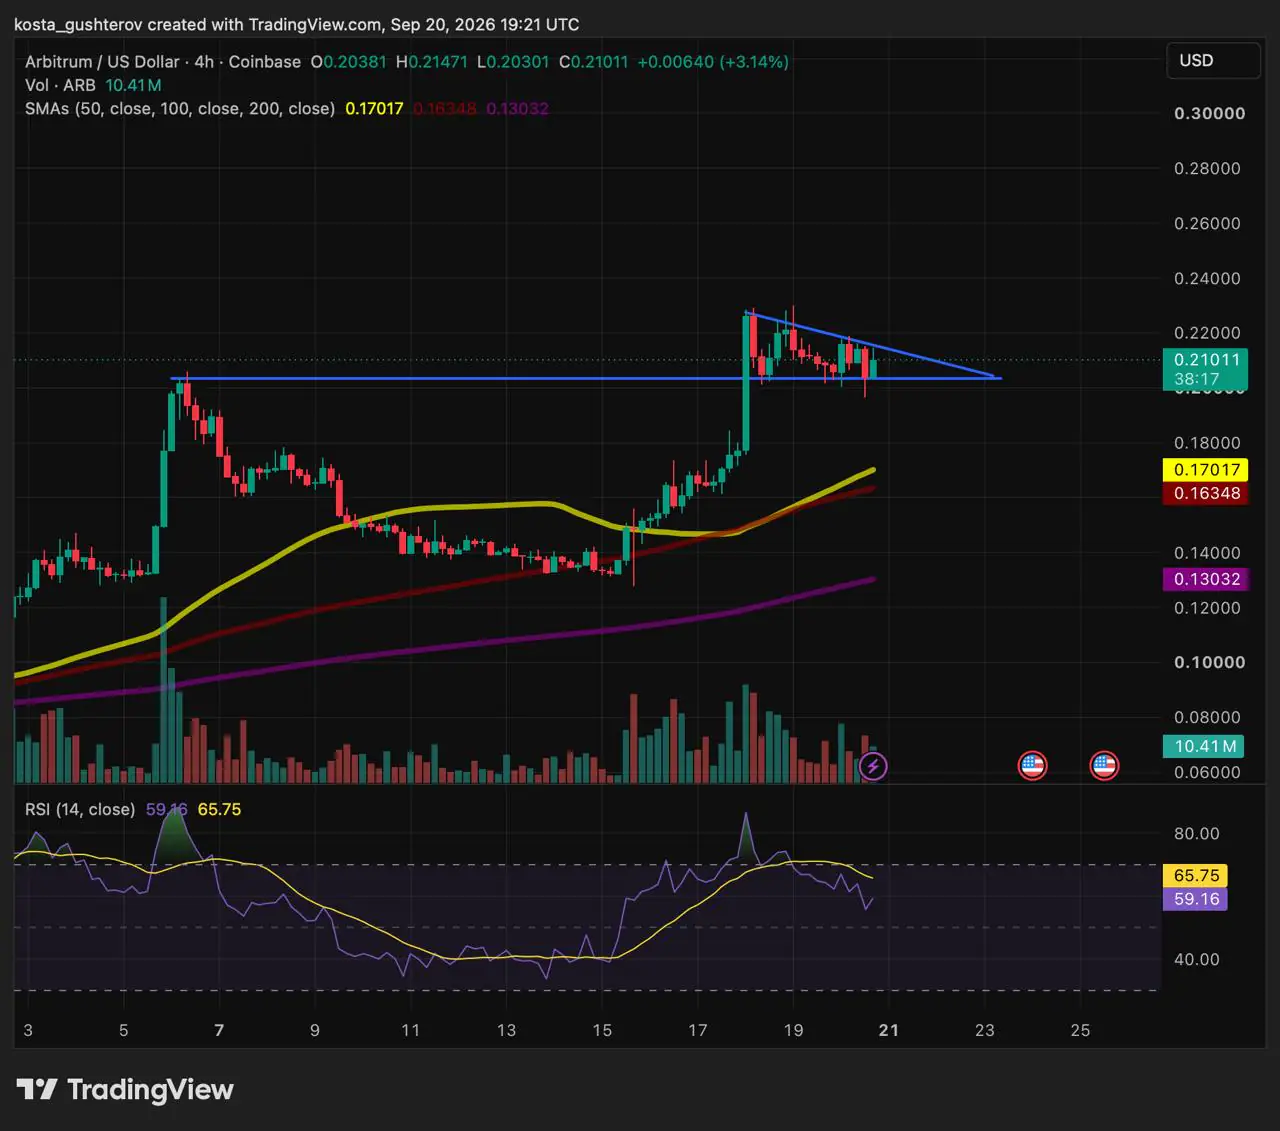
Arbitrum (ARB) changed hands near $0.210 on the Coinbase ARB/USD four-hour chart at 19:21 UTC on September 20, compressing between a descending resistance line and horizontal support in the $0.203–$0.206 range. The band matters because it previously acted in the opposite direction, capping the token earlier this month before price broke through on the way higher. Arbitrum is a layer-2 network built to scale Ethereum, and ARB serves as the governance token of the Arbitrum DAO.
A Former Ceiling Now Tested as Support
ARB climbed to approximately $0.206 on September 6 before sellers pushed it back. An earlier analysis of that rally identified the area as the principal barrier after ARB had more than doubled from its August low.
Price subsequently dropped to roughly $0.13, then recovered through the former ceiling and advanced to $0.228. Buyers are now entering a zone where sellers previously dominated, a potential resistance-to-support flip. That transition does not become permanent simply because price crossed the level once. The flip remains valid only as long as subsequent pullbacks continue to find demand around the reclaimed area.
Traders Typically Read a Bull Flag as Continuation
The sharp advance from about $0.13 to $0.228 formed the flagpole. ARB then began drifting sideways to lower beneath descending resistance while repeatedly finding bids near $0.205. Together, the two legs make up a bull flag, a formation traders generally interpret as a bullish continuation pattern: buyers pausing after a strong advance rather than abandoning the move entirely. The consolidation allows short-term traders to take profits while other buyers enter at lower prices.
The pattern does not guarantee another rally. It becomes more convincing when price closes above the flag's descending upper boundary, particularly if trading volume increases as well. At the time of the chart capture, that boundary sat near $0.214–$0.216, and its exact value will edge lower as the trendline extends.
A break below the flag's lower boundary would send the opposite message, showing that buyers had failed to defend the consolidation and invalidating the immediate continuation setup. A completed four-hour candle is more useful than a brief move through either boundary, because it helps distinguish a sustained break from ordinary intrabar volatility.
If the flag fails, $0.200 provides the first psychological reference, followed by the earlier trading area around $0.190. The four-hour 50-period moving average sits considerably lower near $0.170, leaving room for a sharper correction if the breakout is fully retraced.
RSI Offers Limited Support for Continuation
The four-hour relative strength index (RSI) stood near 59 at the time of the chart capture, down from an overbought reading above 80 during the rally. Momentum has cooled without the indicator slipping into weak or oversold territory.
Closing prices also point to a possible hidden bullish divergence: ARB preserved a slightly higher closing low while RSI moved below its previous trough. Traders often interpret that combination as a continuation signal. The case is less convincing once full candle ranges are considered, however, because one wick briefly moved beneath support. Price still needs to hold the flag and break descending resistance before the divergence gains practical importance.
ARB remains above its four 50-, 100- and 200-period moving averages, located near $0.170, $0.163 and $0.130. The shorter averages sitting above the longer ones support the broader recovery, although all three are too far below the current price to protect the immediate setup.
Geopolitical Risk Meets a Market That Absorbed Two Setbacks
The technical support still faces an external test. Iran has communicated conditions for ending the conflict, including an end to attacks and the lifting of the US naval blockade, while warning that renewed US strikes would bring retaliation. Al Jazeera's latest updates on the Iran war show diplomatic efforts and military threats continuing simultaneously.
Further escalation would not affect Arbitrum's network directly, but it could change the wider conditions in which ARB trades.
How Escalation Could Reach Crypto Prices
Supply disruption could lift energy prices. Higher costs could renew inflation concerns. Rate expectations could push bond yields higher. Investors could reduce speculative market exposure. Leverage could magnify the resulting price move.
This is a risk channel, not a prediction that ARB must fall. The token has already recovered from two developments that initially appeared unfavorable for crypto.
The CLARITY Act failed to secure the 60 Senate votes needed to advance on September 15. Crypto prices initially declined, while approximately $287 million in leveraged long positions were liquidated within an hour around the result. Liquidations of that kind close leveraged positions automatically when margin requirements are no longer met, and the resulting forced selling can deepen a short-term decline. The Federal Reserve then raised its target interest-rate range by 25 basis points on September 16. ARB nevertheless recovered.
The rebound does not make failed legislation or higher interest rates bullish. It shows that sellers could not maintain control after the initial reaction. Positioning, prior expectations and available liquidity will similarly influence how ARB responds to further developments in the Middle East.
ARB Is 53% Higher Than When Standard Chartered Set Its Target
While geopolitics creates the immediate downside risk, Standard Chartered's adoption thesis helps explain why traders may be willing to defend the recent breakout. ARB was trading near $0.137 when the bank's Arbitrum forecast was reported on September 15. At approximately $0.210, the token is now around 53% higher.
Standard Chartered expects ARB to reach $0.50 by the end of 2026 and $10 by the end of 2030. Even after the latest rally, ARB remains about 58% below the first target and would require a further gain of approximately 138% to reach it.
The bank's forecast depends on financial institutions adopting Arbitrum technology for tokenized assets and dedicated networks. The recent price increase does not establish that this adoption will occur at the expected pace.
There is also no automatic route from network revenue to ARB holders. Income generated through Arbitrum-based chains can strengthen the DAO treasury, but the token does not currently provide dividends, mandatory distributions or automatic buybacks. Defending the breakout would therefore show confidence in future value creation rather than demand created by an existing cash-flow right.
The Next Reaction Will Show What Traders Are Defending
A successful defense would suggest that ARB's repricing can survive after the initial momentum has faded and external risks have returned. A failure would indicate that traders moved faster than the adoption and revenue evidence supporting the token's longer-term valuation.
This article is provided for informational purposes only and does not constitute financial or investment advice. Cryptocurrency prices, technical indicators and geopolitical conditions can change rapidly.
Source: Coindoo

