Aptos (APT) Holds $0.52 Support as Falling Wedge Keeps $0.64 Target in View
Key Takeaways
- •APT was trading at $0.5258, down 1.14% over 24 hours and 11.01% over the past week.
- •Analysts said APT was forming a falling wedge near $0.51-$0.52, with $0.517 identified as a critical support level.
- •A confirmed breakout above $0.540 could open the way toward $0.560 and $0.580, while failure to hold support could lead to fresh lows.
- •APT futures volume rose 29.96% to $84.67 million, and open interest increased 3.53% to $87.73 million.
- •APT remained below its 20-day, 50-day, 100-day, and 200-day EMAs, while the RSI stood at 34.30.
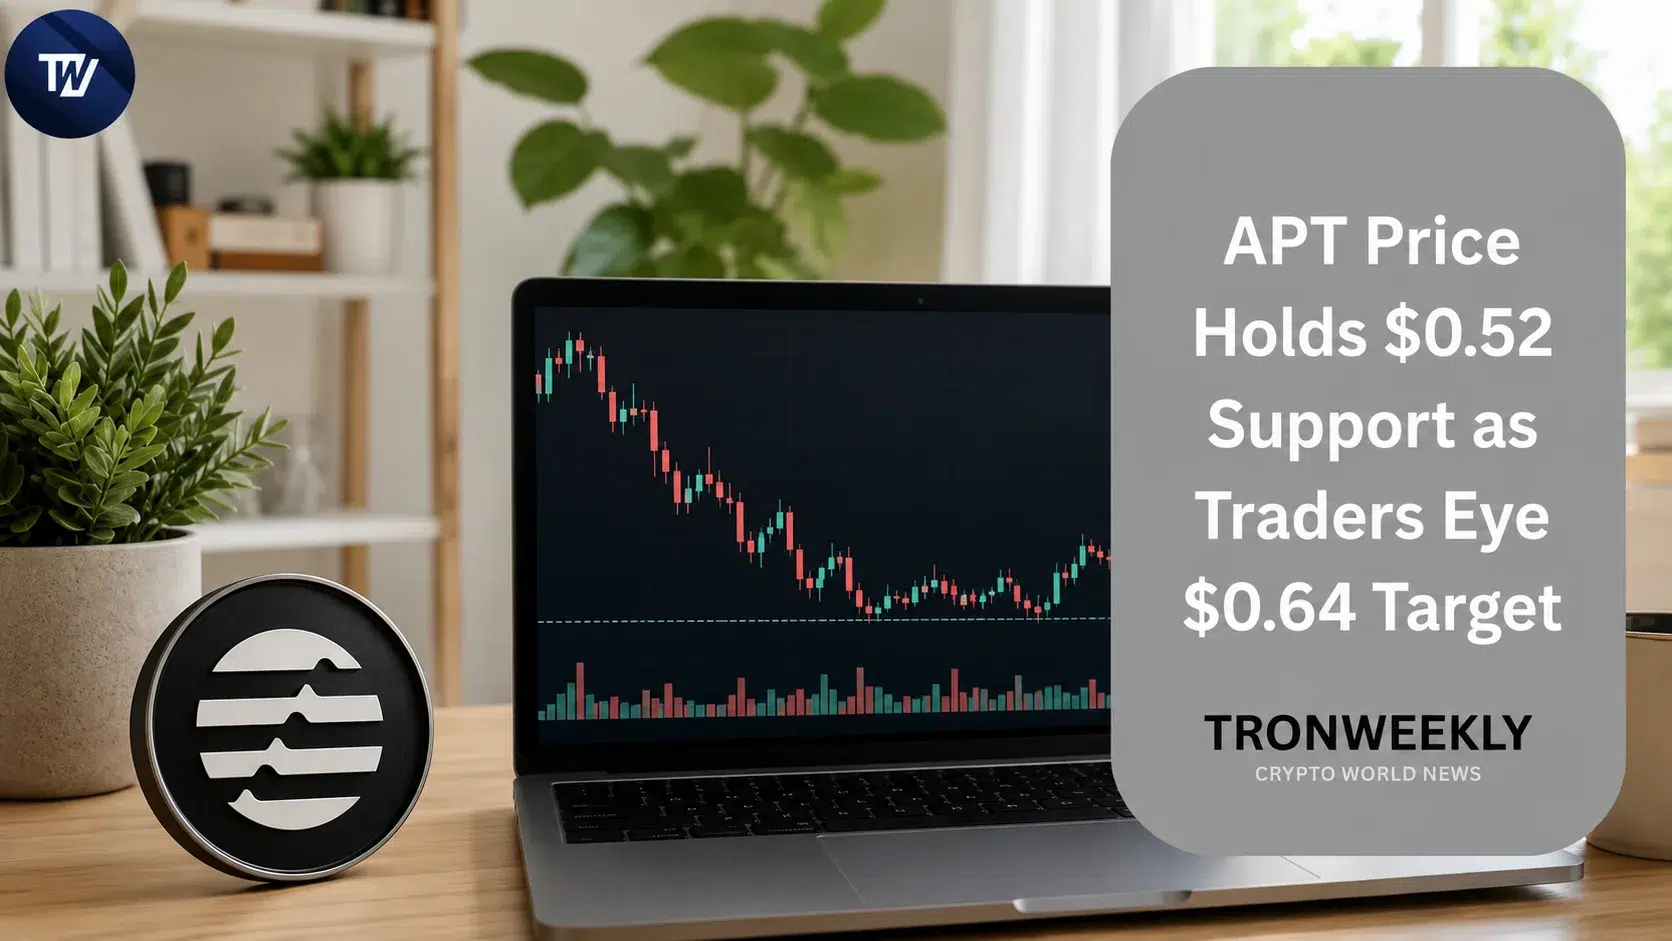
Aptos (APT) traded under pressure on Monday, August 17, 2026, as traders monitored a developing falling wedge pattern and a critical support zone. Market activity rose alongside the decline, and analysts said they were waiting for confirmation of a potential short-term reversal setup.
At the time of writing, APT was trading at $0.5258, down 1.14% over the past 24 hours, according to data from CoinMarketCap. The token's 24-hour trading volume surged 51.2% to $36.95 million even as the price slipped. Over the past week, APT has fallen 11.01%. Aptos is a proof-of-stake Layer 1 blockchain built around the Move programming language, and its developer, Aptos Labs, was founded by former engineers from Meta's shelved Diem blockchain project.
What the Falling Wedge Signals Near $0.52 Support
A falling wedge takes shape as price compresses between two downward-sloping, converging trendlines, a formation many technical analysts associate with a possible bullish reversal when it appears within a downtrend. Analyst Crypto With Gopal noted that APT was forming a falling wedge on the one-hour chart, with price repeatedly pushing into the pattern's lower trendline around the $0.51-$0.52 levels. The repeated rejections at that zone suggested buyers were defending the support level.
According to the analyst, a break above the wedge's resistance could signal bullish continuation, with price potentially moving toward the $0.57-$0.64 levels on an upside break. The setup, however, still required a confirmed breakout.
A second analyst, Binance Killers, identified $0.517 as the crucial support level following APT's steep decline. The token rebounded to $0.526 but failed to move above nearby resistance levels.
For the recovery structure to strengthen, Binance Killers said APT must hold $0.517 and bounce back above $0.540. A clear breakout above $0.540 could allow further moves toward $0.560, with the next target set at $0.580. Conversely, failing to hold the $0.517 support could weaken the existing setup, and the analyst warned that a confirmed breakdown below that threshold would bring fresh lows into focus.
Volume and Open Interest Rise
CoinGlass data showed APT futures trading volume rising 29.96% to $84.67 million. Open interest also increased 3.53% to $87.73 million, indicating growth in outstanding derivatives positions. Open interest measures the total value of derivative contracts yet to be settled, while the funding rate is the recurring payment that keeps perpetual futures aligned with spot prices; a positive rate means long positions pay short positions. The APT OI-weighted funding rate remained positive at 0.0072%.
Liquidations occur when exchanges forcibly close leveraged positions that no longer meet required margin levels. Total APT liquidations over the past 24 hours reached $456,060. Long positions accounted for $358,420 of that figure, while short liquidations stood at $97,650 — a difference of $260,770, with long positions representing the majority of liquidated trades.
Why APT Trades Below Four Key EMAs
Exponential moving averages assign greater weight to recent prices than to older data, which is why they react more quickly to trend changes than simple moving averages. According to TradingView data, the 20-day Exponential Moving Average (EMA) on the daily chart sits at $0.566, with the 50-day EMA slightly higher at $0.605. APT trades below both moving averages, leaving the indicators above the token's market value.
The gap widens across longer timeframes: the 100-day EMA stands at $0.703 and the 200-day EMA at $1.066. Aptos is trading below all four EMAs, each of which represents a possible resistance level for a reversal.
The Relative Strength Index (RSI) stood at 34.30, below its moving average of 42.32. The reading pointed to weak momentum, though the RSI remained above the 30 level that marks oversold conditions.
This article contains market analysis and price projections, which are not guarantees. Crypto markets are volatile, and readers should always conduct their own research. This is not financial advice.

