Altcoin Season Index at 59: The Data Behind Altcoin Cycles and Why They Stay Rare
Key Takeaways
- •The Altcoin Season Index read 59 on October 12, 2026, meaning it would need to rise 16 points to reach the 75 level required to declare an altcoin season.
- •Since 2017, altcoin seasons have accounted for 416 days compared with 956 days of Bitcoin seasons, averaging just 17 days each with the longest lasting 117 days.
- •Bitcoin dominance currently sits around 58-60%, above both the 55% break analysts watch and the sub-50% level often associated with past altseasons.
- •The 381 days elapsed since the last altcoin season ended is unusually long, though it remains shorter than the record gap of 486 days.
- •Bitcoin recently climbed past $86,000 on ETF inflows and treasury buying, while markets assign roughly an 84% probability to a Fed hold in October and elevated odds of a December rate hike.
Altseason is the phenomenon every crypto bull market chases: a stretch when altcoins rise faster than Bitcoin. Attention on it is plentiful. The historical record, however, shows it is far less common than many investors expect.
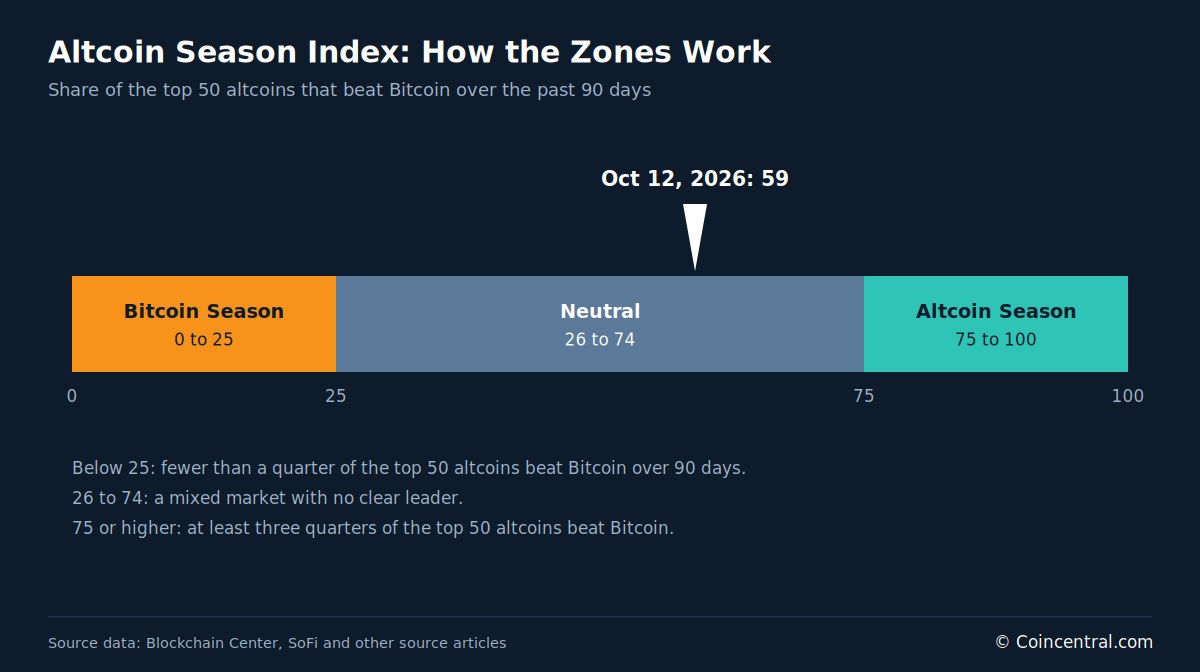
On October 12, 2026, the Altcoin Season Index reads 59. That is below the 75 threshold required to declare a true altcoin season, and it comes 381 days after the last such period ended, according to Blockchain Center data.
This article examines the statistics behind altcoin cycles: how the index is constructed, what Bitcoin dominance reveals, how long seasons have historically lasted, what previous cycles looked like, and how investors try to put this data to use. It is for information only and is not financial advice.
What Altseason Is and How It Is Measured
Altseason, short for altcoin season, refers to a period in which altcoins—any cryptocurrency other than Bitcoin—outperform Bitcoin. During these stretches, capital rotates out of Bitcoin and into other coins.
Bitcoin normally sets the direction for the entire market because of its sheer size. In an altseason, that balance shifts: Bitcoin's share of the total market falls, and many altcoins climb while Bitcoin moves sideways or gains only modestly.
Altseasons typically begin after a strong Bitcoin run. Investors who profited from Bitcoin look for new destinations for their gains, and because altcoins carry smaller market caps, they can rise faster when fresh money arrives.
Bitso describes this process as a cascade. Money flows into Bitcoin first, then into Ethereum and other large altcoins, and finally reaches smaller and more speculative tokens. Social media adds fuel: fear of missing out spreads, and influencers shift from talking about Bitcoin to promoting "hidden gems." Sources treat this change in attention as evidence of a shifting mood.
The most widely used yardstick is the Altcoin Season Index. It measures how many of the top 50 altcoins have beaten Bitcoin over the previous 90 days, excluding stablecoins and asset-backed tokens such as WBTC and stETH, since those assets track the dollar or Bitcoin rather than moving independently against it. The index runs from 0 to 100 and is divided into three zones.
Different platforms publish their own versions. CoinMarketCap and CoinGlass each maintain one, and their methodologies differ, though sources say the broad trends tend to look alike.
One limitation deserves attention. The index is backward-looking, so by the time it confirms an altseason, the most attractive entry prices may already be behind the market.
Where the Altcoin Season Index Stands Today
On October 12, 2026, the Blockchain Center index reads 59, placing the market in the neutral zone. The site itself states that it is not altcoin season.
The same page shows a one-month reading of 57 and a one-year reading of 41. All three figures sit between the Bitcoin season line of 25 and the altcoin season line of 75.
One source characterizes the current level as a recovery from single-digit lows earlier in 2026, citing a range of 35 to 59 depending on how the data is grouped. Even at the top of that range, the reading remains well below the 75 threshold.
The index last changed zones on September 2, 2026, when it moved from Bitcoin season into neutral. That shift indicates Bitcoin's lead has narrowed. It does not indicate that altcoins have taken over. For the market to reach altseason, the index would need to climb 16 points from 59. In 2021, the index reached 98 on April 16, showing how elevated it can go in a powerful cycle.
SoFi identifies three additional signs that a season may be starting: Bitcoin's price steadies after a major rally, new narratives such as DeFi, AI and GameFi take over the news cycle, and retail interest jumps on social media. None of these signals is part of the index, and each can fade quickly.
Bitcoin Dominance: The Other Key Number
Bitcoin dominance measures Bitcoin's share of the total cryptocurrency market value. Sources say it normally sits between 60% and 65%, and that a fall below 50% often points to an altcoin season. In extreme cases, dominance has dropped to between 35% and 40%.
Today, dominance sits at roughly 58.3% to 60%, depending on the day and the data provider.
Analysts quoted by one source name a confirmed break below 55% as the key level to watch in this cycle. Another source says broad altseasons usually require dominance to fall below 50% to 55%.
A decline in dominance can arise from two causes: altcoins rising faster than Bitcoin, or Bitcoin itself falling. In 2017 and 2018, Bitcoin dropped from a record above $20,000 to below $6,000 within a few months. That is why dominance works best when read alongside the index and trading volume—a single number alone can mislead.
Bitso highlights a second ratio: the ETH/BTC pair, which shows how much Ethereum is worth in Bitcoin. When the pair rises steadily, the market is paying more for risk than for safety. Ethereum has often led the rotation, with large altcoins following and small ones arriving last. When the ratio turns down, the rally is often ending even if dollar prices remain elevated.
How Often Altseasons Happen and How Long They Last
Blockchain Center has classified every day since 2017 as either Bitcoin season, neutral or altcoin season. Its season statistics show that altcoin seasons are the rarer of the two market states.
Bitcoin seasons have filled 956 days—more than twice the 416 days recorded for altcoin seasons. The longest altcoin season lasted 117 days, while the longest Bitcoin season ran 126 days.
The average altcoin season has lasted 17 days, and the average gap between seasons has been 67 days. The current gap stands at 381 days—unusually long, but still shorter than the record of 486 days.
Written guides offer longer estimates. SoFi says seasons have lasted one or two months; another source says a few weeks to a couple of months; a third says anywhere from a week to several months. The 17-day average sits below those ranges, likely because it counts only days on which the index sits at 75 or higher. Rallies described in news reports and on social media can run considerably longer than that.
These figures carry limitations. They rest on a single site's methodology and a 90-day lookback window, and a different index could produce different counts. The pattern, however, is clear: Bitcoin leads more often, and altcoin leadership arrives in short bursts.
What Happened in Past Altcoin Cycles
The sources point to three main cycles, each with different drivers and different outcomes.
The 2017 cycle was driven by speculators, a wave of new project launches and a flood of incoming money. Ethereum, Ripple, Litecoin and Bitcoin Cash ranked among the top performers.
The 2021 cycle unfolded during the pandemic. Federal Reserve bond purchases and stimulus payments pushed investors toward risk, while NFTs and meme coins drew in new buyers. Shiba Inu, Dogecoin, Solana and Polygon were among the leaders.
Bitso provides figures for January to May 2021: Bitcoin rose about 90%, Dogecoin gained more than 12,000%, and Solana climbed from $1.50 to $55. The ending was abrupt. In the May 2021 correction, most of those tokens lost more than half their value within two weeks.
The 2024 to 2025 period looked different. Ethereum, Solana and many Layer-1 and Layer-2 tokens—the base blockchains and the scaling networks built on top of them—gained following the ETF approvals and the halving, the pre-programmed event that periodically cuts new Bitcoin issuance. Memecoins such as WIF and BONK posted large runs, but the rally never matched the earlier cycles in either length or breadth.
SoFi draws one lesson from these episodes: crypto markets are frequently driven by hype and heavy speculation, and outside events—such as a health emergency or softer government attitudes toward crypto—have also played a part. In each case the market was difficult to predict while it was unfolding. Most participants only recognized they were in an altseason once it was already underway.
Market Conditions in October 2026
Bitcoin recently rose past $86,000, a move one source credits to steady ETF inflows and company treasury buying. Dominance stands near 58.8% to 60%.
Interest rates represent the main pressure on the market. The Federal Reserve's policy rate sits at 3.75% to 4.00%, and September payrolls added just 29,000 jobs. Market odds put the chance of a hold at the October 27 to 28 meeting at roughly 84%, while CME FedWatch and the prediction market Kalshi place the probability of a rate hike in December at 65% to 75% or more.
Rates matter because Bitcoin and altcoins pay no yield, meaning they compete directly with cash and bonds for investor capital. In 2021, Fed bond purchases helped fuel one of the strongest altcoin seasons on record.
The September CPI report, the most closely watched inflation gauge, is due on October 14. A hot inflation print could push money back toward cash.
Token supply also affects prices. Ethena (ENA) fell about 9% ahead of an unlock of 3.03 billion tokens—the kind of scheduled release that expands the supply available to sell. Meanwhile, real-world asset tokenization, next-generation DeFi and AI infrastructure are drawing the most concentrated inflows this year.
Institutional money adds another layer. One source notes that the market is more crowded now because of institutional inflows, which means past cycles may not repeat in the same way.
A hold in October would give the market some breathing room. A hike in December would place additional pressure on speculative assets. Taken together, the CPI print, the Fed meeting and the December decision give the altseason question its nearest set of dated checkpoints.
Why Altcoins Move So Fast—In Both Directions
Size is the primary reason. Bitcoin is worth trillions of dollars, while many altcoins carry market caps under $10 billion and some are worth only a few million. Bitso notes that moving the price of a $100 million token requires a fraction of the money needed to move Bitcoin by 1%—and that dynamic works in both directions.
Sources cite gains of more than 300% within a few months for some altcoins. Solana is said to have gained 300% in two weeks during one run, and memecoins have posted gains of 1,000% in a single month.
Losses can arrive just as quickly. Prices can fall 30% to 50% or more within hours, and some coins never reach a new high after dropping more than 90% in a bear market.
The sources list additional risks. Weak projects can surge on hype and then crash. Small coins can be difficult to sell at a fair price. New regulations can change trading rules rapidly, and rug pulls—in which a project's creators abandon it and keep investor funds—still occur.
Bitso offers one late-stage warning sign: when two-week-old memecoins lead the market, there is often little room left to run.
How to Invest in Altseason Using the Data
Every source agrees on one point: nobody can time an altseason with certainty. The data can still help investors establish rules before money is committed.
Research comes first. Check how many tokens are in circulation and how supply is distributed. Examine the technology, the roadmap and whether developers are actively working. Approach influencers with caution—the sources warn that many promote tokens for their own profit.
Diversification comes next. Large coins such as Ethereum, Solana and Ripple tend to be steadier than mid-caps and small caps, and some investors keep part of a portfolio in stablecoins or Bitcoin as a buffer.
Exits matter as much as entries. One source describes a simple method: sell 10% of a position each time the coin rises 20%. Limit orders and stop-loss orders can remove emotion from trading, and some investors move part of their gains into stablecoins such as USDC.
Several other rules recur across the sources. Set a budget and never invest more than you can afford to lose. Account for transaction fees, which accumulate with frequent trading. Use secure wallets and two-factor authentication.
Finally, watch for fear of missing out. By the time most retail traders notice a rally, the coins involved may already be up 300%—and buying at that point often means buying near the top.
Altseason Statistics: Common Questions
What Altcoin Season Index reading counts as altseason?
A reading of 75 or higher. That means at least 75% of the top 50 altcoins beat Bitcoin over the past 90 days. A reading of 25 or lower is called Bitcoin season.
Is it altseason right now?
No. The index reads 59 and Bitcoin dominance is near 59%. Both sit short of the levels seen in past altseasons.
How long do altseasons last?
Blockchain Center puts the average at 17 days and the longest at 117 days. Written guides describe durations ranging from a few weeks to several months.
What is a normal level for Bitcoin dominance?
Sources say Bitcoin usually holds between 60% and 65%. A fall below 50% often points to an altcoin season.
Can anyone predict an altseason?
No source claims a reliable forecasting method. The index, dominance and trading volume can help, but they often move only after a rally has started.
What usually ends an altseason?
Bitso says it ends when new money runs out and gains concentrate in coins with no fundamentals. SoFi adds that a Bitcoin rally can signal a return to Bitcoin's leadership.
What the Numbers Say
The Altcoin Season Index reads 59, and Bitcoin dominance sits near 59%. Both fall short of the levels that have marked past altseasons, and the last one ended 381 days ago.
History shows altseasons are short—an average of 17 days by Blockchain Center's count—and sharp. Gains and losses of several hundred percent have both been recorded, most dramatically in 2021.
Whether another altseason arrives in 2026 or 2027 remains unknown. The sources point to interest rates, Bitcoin's trend and investor sentiment as the main determining factors. Readers should do their own research before acting.
Sources
Understanding Altcoin Season: Trends, Triggers, and Strategies
What is altseason and will there be one in 2026/2027?
Altcoin Season: understanding this opportunity
Altcoin Season: How to Catch the Wave Before It Peaks
What is Altcoin Season? When is Altseason in October 2026?
Altcoin Season Index
What is altseason?
This article first appeared on CoinCentral.

