Altcoin Market Cap Retests Resistance as ETH/BTC Breaks Out of Four-Year Wedge
Key Takeaways
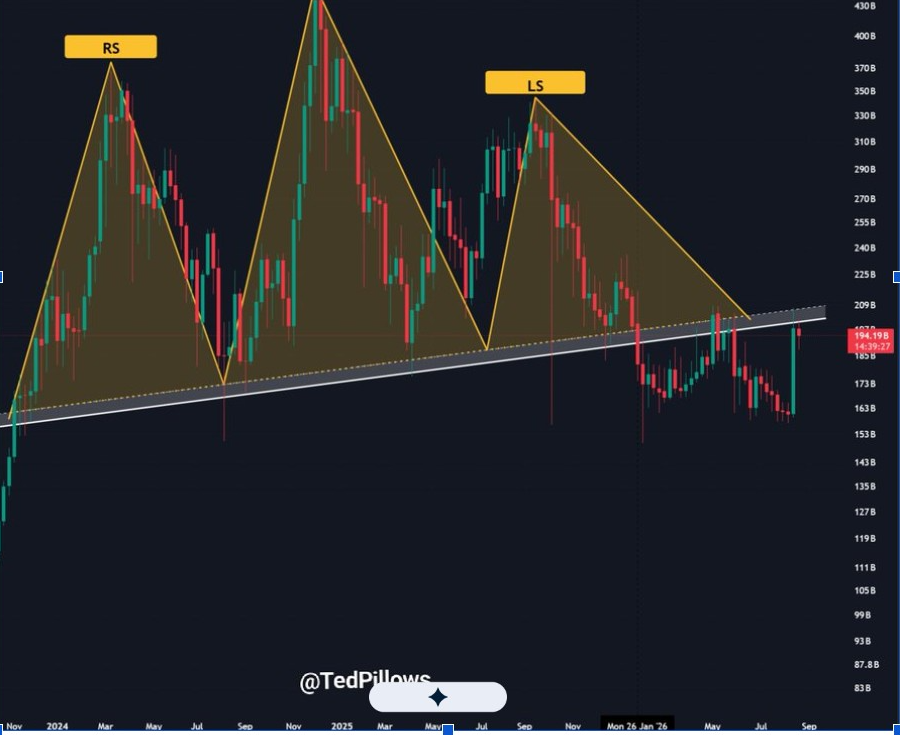
- •Altcoin market capitalization was rejected once more near a key resistance zone around $200 billion.
- •The altcoin market's RSI has broken above a downtrend that had persisted for roughly two and a half years.
- •ETH/BTC has broken above a descending broadening wedge that formed over nearly four years.
- •Bitcoin dominance stands near 60% after declining from a 2025 peak in the mid-60% range.
- •The TOTAL3-to-Bitcoin ratio is near a relative support zone comparable to floors seen in 2017 and 2021.
Key Insights
- The altcoin market cap was rejected once again near a key resistance zone around $200 billion.
- The altcoin RSI has broken above a downtrend that had persisted for roughly two and a half years.
- ETH/BTC has broken out of a descending broadening wedge that formed over nearly four years.
The altcoin market is testing a long-term resistance area after recovering from its recent lows, while Ethereum has moved above a four-year descending broadening wedge against Bitcoin. The two charts depict a market at an important technical juncture: broader altcoin capitalization is approaching a ceiling, ETH/BTC is showing a shift in its long-term structure, and Bitcoin dominance remains near a level traders watch for signs of capital rotation. Technical patterns of this kind are watched by traders as potential signals of trend changes, though breakouts and retests can fail, and prior chart structures do not guarantee future outcomes.
Altcoin Market Cap Tests Long-Term Resistance
The altcoin market capitalization chart shows price approaching a descending resistance trendline that has contained previous rallies. The latest move followed a recovery from the lower boundary of the broader structure, which has been rising since 2024, and price has now reached the same area where earlier advances lost momentum.
The chart displays a series of swings between rising support and falling resistance. The descending upper trendline has limited upside moves, while the lower trendline has provided a progressively higher floor over time.
The RSI breakout adds a momentum-based signal alongside the price structure. RSI, or the Relative Strength Index, measures the speed and magnitude of price changes, and traders commonly use it to gauge whether an asset's momentum is shifting. A break above a multi-year RSI downtrend is the kind of development chartists track when assessing whether a longer trend may be turning, although momentum signals and price breakouts can diverge.
A break above the upper boundary would move the market outside its established range. A rejection at the same level, however, would leave the current structure intact and could send altcoin capitalization back toward its rising support.
ETH/BTC Moves Above Four-Year Wedge
The ETH/BTC chart shows Ethereum's relative value against Bitcoin breaking above the upper boundary of a descending broadening wedge. The pattern developed over several years, with the pair recording lower highs and wider price swings, and the latest move places the ratio above the trendline that had capped previous advances.
A sustained move higher in ETH/BTC would indicate that Ethereum is gaining ground against Bitcoin on a relative basis. The ratio is one of the most widely followed pairs in crypto trading because it expresses relative performance directly: the pair can rise even when both assets fall in dollar terms, provided Ethereum falls less than Bitcoin. The chart does not confirm a broad altcoin rally, but ETH/BTC remains a closely watched ratio when market participants assess rotation beyond Bitcoin. The recent breakout therefore adds another technical signal to the wider altcoin market setup.
Bitcoin Dominance Nears a Key Level
Bitcoin dominance remains around the 60% area after reaching a 2025 peak near the mid-60% range. The chart shows dominance declining from that peak before moving sideways through much of the recent period. A fresh move lower would reduce Bitcoin's share of total crypto market capitalization if other assets maintain or increase their market value. Dominance is derived from market capitalization, so it can shift either through Bitcoin price changes or through changes in the combined value of all other assets, making it an aggregate rather than asset-specific signal.
At the same time, the ETH/BTC ratio has recovered from its 2025 low, moving toward the 40% area shown on the chart's relative scale.
TOTAL3 Tracks a Historical Support Zone
TOTAL3 is a commonly used market metric that measures total crypto market capitalization excluding Bitcoin and Ethereum, making it a broad proxy for the altcoin sector as a whole. The longer-term TOTAL3-to-Bitcoin chart places the broader altcoin market near a relative support area that previously appeared before major expansions. The chart marks comparable floors around the 2017 and 2021 cycle periods, followed by advances toward a descending resistance line. Comparable historical placements on a chart describe past price behavior and do not by themselves establish that similar outcomes will recur.
The current ratio has returned close to the lower part of the structure after several years of weaker performance against Bitcoin. A recovery from the support zone could open room for a move toward the upper resistance area, while a loss of support would keep the longer-term downtrend in place.
Across the charts, the key conditions shown for the broader altcoin market are a sustained altcoin market-cap breakout, continued strength in ETH/BTC, and a further decline in Bitcoin dominance.
