Altcoins Test Two-Year Downtrend Breakout as Market Cap Jumps 10% This Week
Key Takeaways
- •The altcoin market cap, tracked by the OTHERS index that excludes the 10 largest cryptocurrencies, climbed approximately 10.4% this week from about $199 billion to $219.8 billion.
- •The advance carried the index into its strongest weekly test of a descending trendline anchored to the 2024 peak near $451.3 billion, a resistance level that rejected multiple recovery attempts through 2025 and the first half of 2026.
- •Bitcoin climbed back above $80,000 on Sept. 19 despite the Federal Reserve raising rates to 3.75%–4.00%, the Bank of Japan lifting rates to 1.25%, and the U.S. Senate's failure on Sept. 15 to advance the CLARITY Act.
- •A support zone between $160 billion and $190 billion, defended repeatedly over the past 1,000 days, is viewed as the nearest downside reference level if the breakout attempt fails.
- •Momentum improved as the MACD line crossed above its signal line and price held above the long-term moving average near $200 billion, but analysts note the weekly close remains the decisive confirmation point for a genuine breakout.
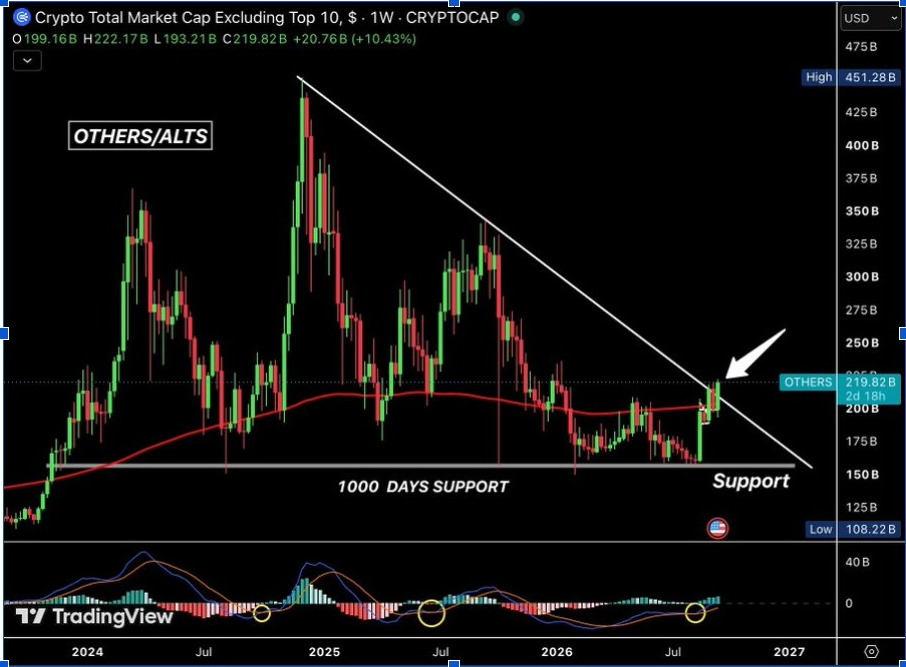
The combined market capitalization of cryptocurrencies outside the top 10 climbed roughly 10% this week, pushing the altcoin market into its most significant test yet of a downtrend line that has capped prices for two years.
The TradingView OTHERS chart, which tracks the market cap of all cryptocurrencies excluding the 10 largest, reached approximately $219.8 billion as it pressed against the descending trendline. Because it strips out the largest assets by value, the gauge is widely used as a read on how capital is rotating through the rest of the market. The move coincided with a rebound in Bitcoin, which climbed back above $80,000 on Sept. 19 despite higher interest rates in the United States and Japan and a legislative setback in the U.S. Senate.
Altcoin Market Cap Challenges a Two-Year Ceiling
The weekly OTHERS chart shows the altcoin market cap rising from roughly $199 billion to about $219.8 billion over the week, a gain of approximately 10.4%. The advance carried the metric through a descending trendline drawn from the 2024 peak near $451.3 billion. In technical analysis, a trendline anchored to a major peak is treated as resistance until price closes above it on the timeframe being traded, which is why chart analysts attach particular weight to the weekly candle.
That trendline rejected multiple recovery attempts throughout 2025 and the first half of 2026, keeping the broader altcoin market confined beneath a long-standing ceiling. Attention now turns to the weekly close, the confirmation point conventionally used to filter out short-term noise before a breakout is judged genuine.
The same chart marks a broad support zone between $160 billion and $190 billion, an area the market cap has repeatedly defended over the past 1,000 days, including several retests through 2025 and 2026. Levels that have absorbed repeated selling are typically treated as reference points for both confirmation and downside risk. Analyst Ash Crypto said on X that a weekly close above the trendline would keep the breakout attempt active, while a failed move could send the index back toward that support range, which now serves as the nearest reference level.
Macro Pressure Fails to Halt the Weekly Rebound
The breakout attempt capped a volatile week across global markets. On Sept. 15, the U.S. Senate failed to advance the CLARITY Act after the bill — a market-structure proposal intended to clarify how digital assets are regulated in the United States — fell short of the 60 votes required to move forward. The Federal Reserve followed on Sept. 16 with a 25-basis-point rate increase, lifting its target range to 3.75%–4.00%. The Bank of Japan raised rates by 25 basis points to 1.25% on Sept. 18. Policy moves of that kind raise borrowing costs across the financial system, a backdrop in which risk assets generally find less support.
The U.S. dollar also strengthened, with the dollar index trading above 100 during the week. It stood at 100.23 on Sept. 17, near a seven-week high, while Brent crude closed at $104.82 per barrel the same day.
Despite those headwinds, Bitcoin held above the $77,000 level, recovered from its midweek decline and moved back above $80,000 on Sept. 19. The OTHERS index, meanwhile, posted its strongest weekly breakout attempt of 2026.
Cycle Charts Frame the Move Within a Larger Structure
A separate two-week chart from analyst Moustache (@el_crypto_prof) compares the current altcoin structure with earlier market cycles. The chart tracks the crypto market cap excluding the top 10 assets and divides prior cycles into accumulation, breakout, expansion, and peak phases.
The analyst identifies similar descending formations ahead of the 2016 and 2020 advances and places the 2026 market near another proposed Phase 2 breakout. The chart's projected path points to a later expansion phase extending into 2026 and 2027, though that portion represents the analyst's model rather than recorded market data. Phase frameworks of this kind are interpretive tools — they map past cycles onto the present rather than measure it directly.
Momentum Improves, but the Weekly Close Remains Decisive
Momentum indicators on the weekly OTHERS chart also turned higher. The MACD histogram moved into positive territory, and the MACD line crossed above its signal line — a crossover that conventionally signals a shift toward positive momentum, with the histogram gauging its strength. Price also holds above the red long-term moving average near $200 billion.
Those readings point to firmer weekly momentum, although the descending trendline keeps the current weekly close a critical technical level. The market has not returned to its previous high — OTHERS still trades well below the roughly $451 billion peak shown on the chart.
For now, the central technical test is whether altcoins can keep the weekly market cap above the broken trendline and avoid a slide back into the support zone below.
This article is for informational purposes only and does not constitute financial or investment advice. Cryptocurrency investments involve risk, and past performance does not guarantee future results. Readers should conduct their own research before making investment decisions.
Based on reporting originally published by The Market Periodical.

