Algorand Hovers Near All-Time Low as Multi-Timeframe Charts Signal Persistent Weakness
Key Takeaways
- •ALGO is trading near $0.083, only about 3.5% above its March 29 all-time low of $0.0797.
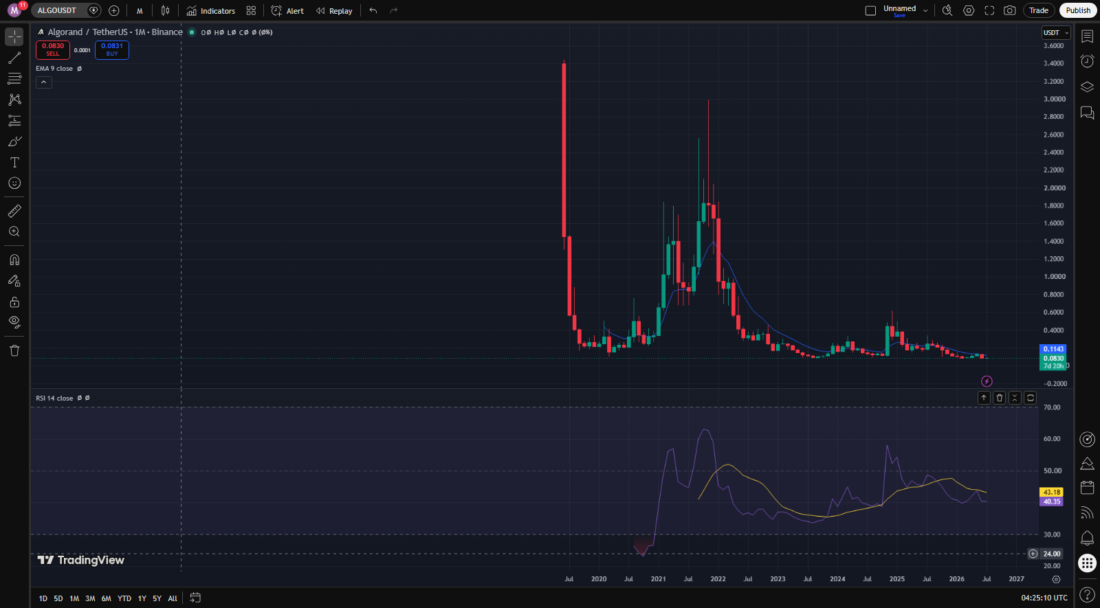
- •The token has fallen approximately 97.7% from its June 2019 all-time high of $3.56.
- •Daily price action has remained largely range-bound between $0.08 and $0.09 after failed breakout attempts in May and June.
- •CoinGecko data shows ALGO has declined about 13% over 30 days and 69% over the past year.
- •ALGO’s 24-hour trading volume was about $18.3 million, while its market capitalization stood near $743 million, ranking it 77th.
Algorand (ALGO) is trading approximately 3.5% above the all-time low it established on March 29 at $0.0797, and a review of six timeframes suggests the token remains trapped between directionless chop and a protracted downtrend — with no clear signal of a breakout in either direction.
Launched in 2019 by MIT professor and Turing Award recipient Silvio Micali, Algorand is a Layer-1 blockchain using a Pure Proof-of-Stake consensus mechanism that has historically emphasized enterprise partnerships, CBDC pilots, and carbon-negative claims as differentiators in a crowded smart contract platform space. Despite those initiatives, ALGO's price performance has diverged sharply from its technology roadmap narrative.
A Seven-Year Decline From 2019 Highs
On the monthly chart, the most prominent figure is 97.7% — the approximate drawdown from ALGO's all-time high of $3.56 reached in June 2019. Seven years later, the token continues to trade near its lowest levels on record. This places ALGO among a cohort of 2018–2019-era Layer-1 tokens that have struggled to retain market share against newer competitors and the dominant network effects of Ethereum and Solana.
Monthly RSI currently reads 43, sitting below the 50 midline and drifting lower. No bullish divergence against price is visible at this time. The reading reflects a market that has been steadily losing value over an extended period rather than one in oversold territory.
Weekly Chart: An Uninterrupted Grind Lower
The weekly timeframe tells a similar story with greater granularity. ALGO peaked near $0.60 in mid-2023 and has been grinding lower in an almost uninterrupted stair-step decline since then. The only notable interruption was a brief spike toward $0.50 in late 2024, which rolled over and resumed the downtrend.
Weekly RSI sits between 36 and 40, a bearish reading but not at levels typically associated with capitulation.
Daily Range: Boxed Between Eight and Nine Cents
On the daily chart, range-bound behavior has overtaken trend as the dominant feature. ALGO attempted a breakout in May, spiking to $0.135 before being rejected. A second attempt in June near $0.104 was rejected even more firmly. Since then, price has been largely confined between $0.08 on the downside and $0.09 on the upside.
Daily RSI stands at 41, sitting just below the neutral threshold. Price is also trading beneath its 9-day EMA, currently around $0.0954 — a level meaningfully above where the token actually trades. The short-term trend has not yet reversed, even though selling pressure appears to have moderated somewhat.
4-Hour Chart: Four Weeks of Consolidation
The 4-hour timeframe reveals an even tighter range, approximately $0.082 to $0.088, which has held for close to a month. RSI oscillates repeatedly between the high 30s and mid 60s within this narrow band. The pattern is best characterized as chop rather than a directional trend, and does not present clear evidence of accumulation.
Short-Term Bounce Off Oversold Reading
Over the most recent day of trading, price dropped to $0.0818 on the 15-minute chart, pushing RSI below 20 into oversold territory before recovering the full move within a handful of candles. ALGO is currently trading around $0.083 with 15-minute RSI near 55.
On the hourly chart, this recovery appears as a bounce off the lower bound of a range that has held since July 17, roughly $0.0815 to $0.0854. While notable, a single bounce from an oversold reading on a 15-minute timeframe does not constitute conclusive evidence of a broader reversal.
Market Data and Volume
According to CoinGecko, ALGO is down 1.9% over the past 24 hours and up slightly less than 1% over the past seven days, lagging both the broader crypto market and its Smart Contract Platform sector peers. The 30-day performance shows a decline of approximately 13%, while the one-year return stands at negative 69%.
Trading volume over the past 24 hours was approximately $18.3 million, down nearly 3% from the prior day. Market capitalization remains near $743 million, placing ALGO at rank 77. The majority of ALGO/USDT trading flow is handled on OKX and Binance.
Key Level to Watch
The central reference point remains the March 29 all-time low of $0.0797. ALGO has spent four consecutive months unable to establish meaningful distance above that level. The current configuration — choppy consolidation in the upper portion of the range and a fresh bounce near the lows — does not provide a definitive indication of the eventual direction of the next move.
Chart data sourced from TradingView / Binance.

