Alcohol Stocks After the Selloff: Why a 70% Decline Is Not an Investment Thesis
Key Takeaways
- •Gallup's August 2026 survey found 54% of U.S. adults drink alcohol, matching the prior year's record low and down from 62% in 2023, while IWSR reported total U.S. beverage-alcohol volume fell 5% in 2025.
- •Despite trading roughly 87.4% below its historical high, Boston Beer carried the highest forward earnings multiple among the companies with estimates available, showing that deep selloffs do not guarantee cheap valuations.
- •Recent results diverged across producers: AB InBev's organic revenue rose 5.6% and Constellation's beer net sales grew 5%, while Molson Coors reported net sales down 3.3% with underlying EPS down 22.9%, and Boston Beer depletions fell 6%.
- •Non-alcoholic products are growing but remain small relative to core businesses, as AB InBev's no-alcohol beer revenue rose 27% globally and Molson Coors planned a 2027 nationwide U.S. rollout of Coors 0.0, though launches are not yet material earnings contributors.
- •Molson Coors and Diageo initially rose after August 6 results but later traded below pre-report prices through October 9, while Constellation gained 6.0% in the three sessions after its October 6 report, underscoring that results are judged against expectations.
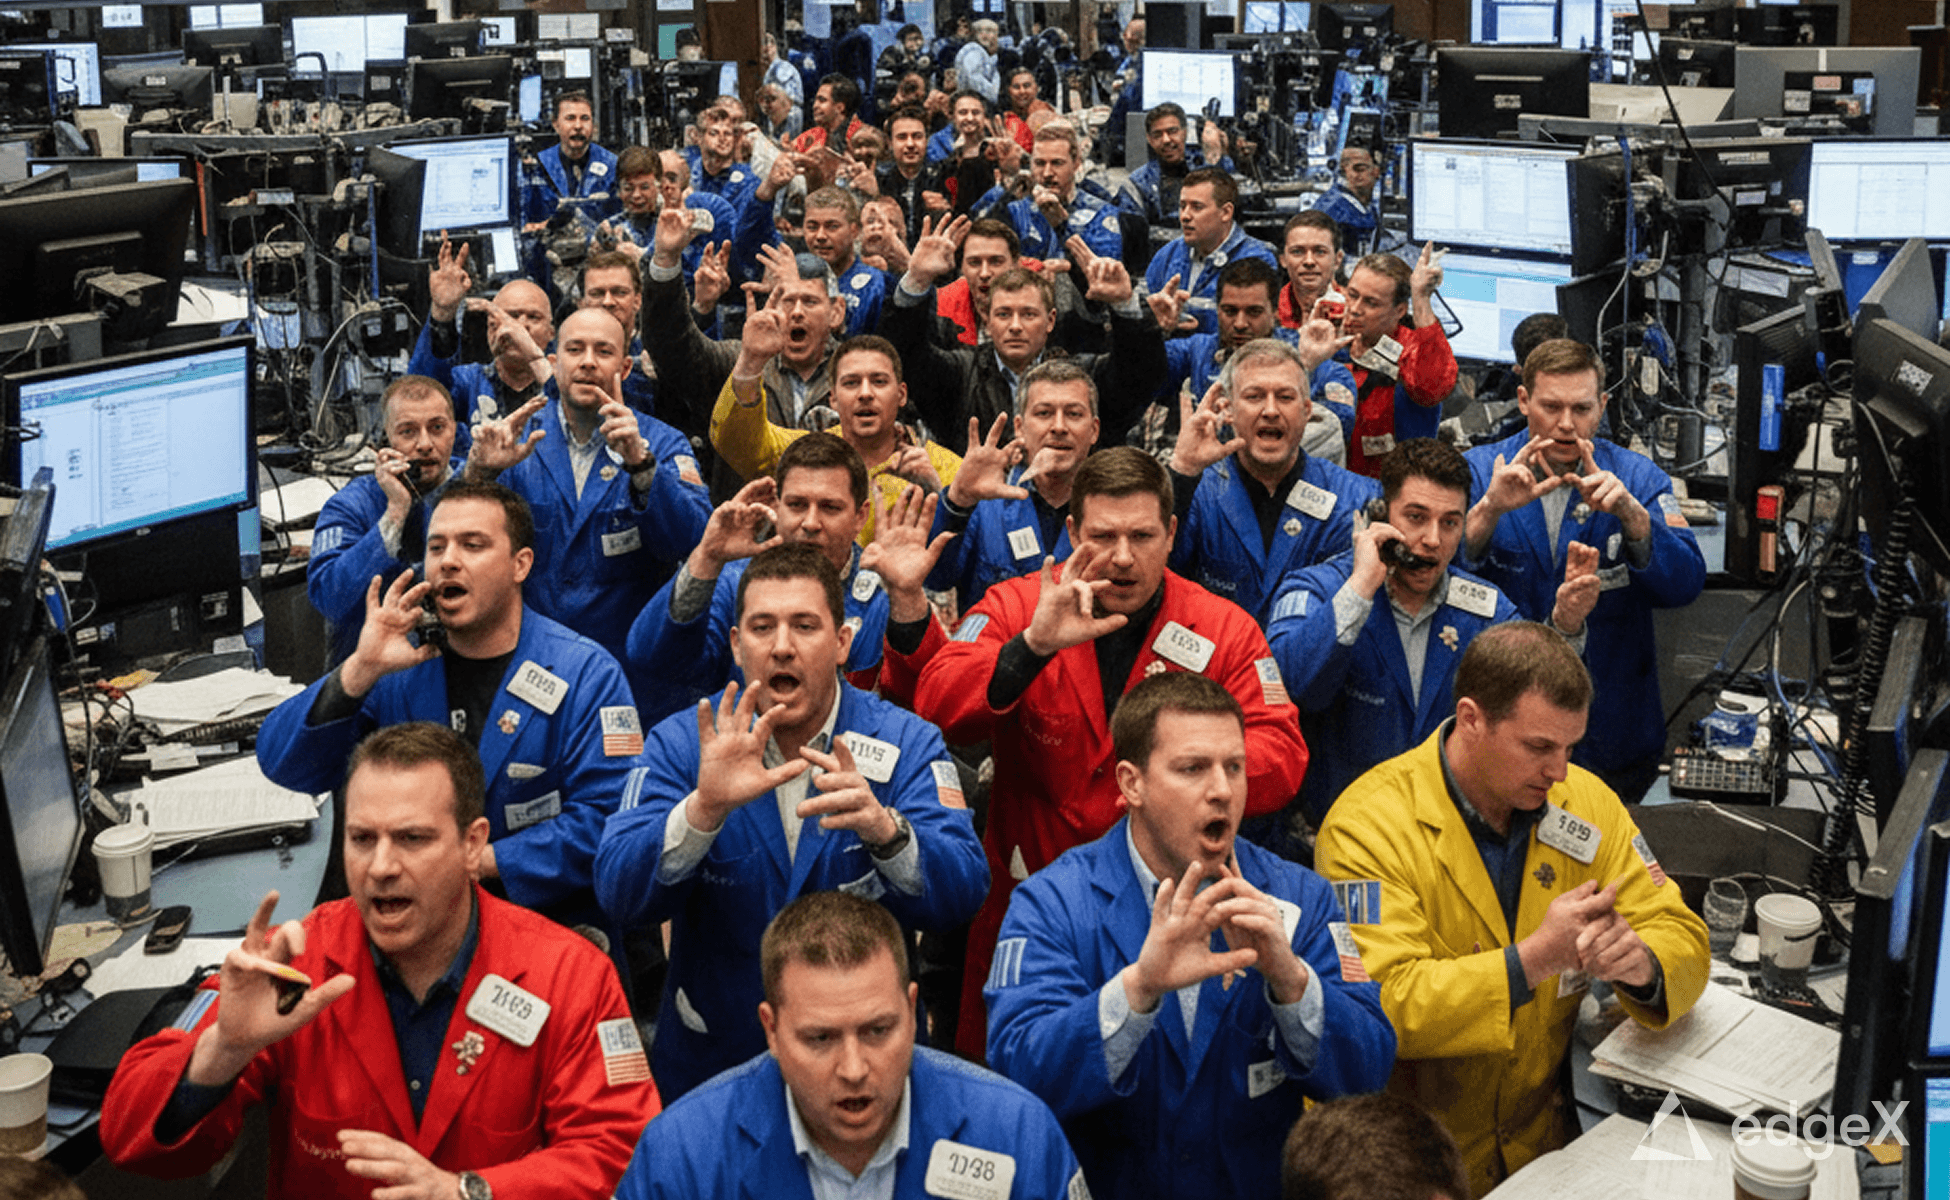
Analysis as of October 10, 2026. Share-price comparisons use U.S. regular-session closing prices through October 9, 2026, in U.S. dollars.
Alcohol stocks may look attractive after a steep selloff, but the largest decline does not necessarily indicate the lowest earnings multiple. Changing drinking habits, non-alcoholic products, luxury spending and regional demand affect producers differently. A stock down 70% can still fall further if expected earnings decline; a 70% fall can become a 90% decline from the former high. Deciding not to buy a stock is also separate from deciding to short it.
Drinking habits and demand
According to Gallup's August 2026 survey, 54% of U.S. adults said they drink alcohol, matching the previous year's record low and down from 62% in 2023. Gallup's 2025 analysis found reported drinking among Americans aged 18 to 34 fell from 59% in 2023 to 50% in 2025. In the August survey, 51% said consuming one or two alcoholic drinks per day was bad for health.
According to IWSR's U.S. consumption report, total U.S. beverage-alcohol volume fell 5% in 2025. Beer and wine each declined 6%, while spirits fell 4%. IWSR separately reported a 2% decline in global beverage-alcohol volume in 2025, the third consecutive annual decline. The International Organisation of Vine and Wine estimated in its 2025 sector report that global wine consumption fell 2.7% to 208 million hectolitres, approximately 14% below 2018 levels.
The Gen Z narrative still requires qualification. IWSR's July 2026 consumer survey found drinking participation among Gen Z consumers of legal drinking age across 15 markets was 74%, up from 66% three years earlier. Boomers had the lowest participation rate in that survey, at 71%. Average drinks per occasion nevertheless fell from 4.4 in 2024 and 2025 to 3.9 in the first half of 2026.
Gallup and IWSR use different questions, age definitions and samples, so their percentages are not interchangeable. The business implication is that a company can retain customers while losing some purchases: a consumer who still drinks but does so less often can create a significant revenue problem without becoming a non-drinker. Affordability also matters. Investors must distinguish weakness that could ease if household finances improve from habits that may persist during a stronger economy.
Geography and company exposure
In its June 2026 outlook, IWSR forecast global alcohol volume would resume growth around 2031 and finish 2035 approximately 1% below 2025 levels. Between 2025 and 2035, servings were forecast to decline 18% in the United States and 14% in Germany, while India was forecast to grow 38%. These are forecasts, not established outcomes, and global volume and national servings are different measures. They nevertheless show why an industry-wide stabilization could benefit companies with growth exposure while leaving those concentrated in shrinking markets behind.
The six-company comparison includes four U.S.-based producers and two international groups accessible through U.S.-listed ADRs.
Constellation Brands, NYSE: STZ
Constellation provides U.S. exposure to imported beer brands including Modelo, Corona and Pacifico. Its October 6 fiscal second-quarter report showed beer net sales growth of 5% and shipment growth of 5.5%, while beer depletions fell 0.6%, according to the company's earnings release. Depletions measure distributor sales to retailers, not final-consumer purchases, so higher shipments do not automatically prove stronger end demand.
Molson Coors, NYSE: TAP
Molson Coors reported August 6 second-quarter net sales down 3.3%, brand volume down 4.8% and underlying diluted earnings per share down 22.9%, according to its results announcement. Favorable pricing and product mix only partly offset lower volumes.
Brown-Forman, NYSE: BF.B
Brown-Forman's brands include Jack Daniel's and Woodford Reserve. Its September 2 fiscal first-quarter report showed organic net sales down 1%, while organic ready-to-drink sales rose 11%. Management retained its forecast for approximately flat annual organic sales and a 3% to 5% decline in organic operating income, according to its fiscal 2027 results release.
Boston Beer, NYSE: SAM
Boston Beer's brands include Samuel Adams, Twisted Tea, Truly and Sun Cruiser. Its July 23 second-quarter report showed depletions down 6% and net revenue down 3.3%; Sun Cruiser and Angry Orchard growth partly offset declines elsewhere, according to the company's earnings release. A supplier dispute created a significant difference between reported and adjusted earnings and should be considered separately from the operating trend.
Diageo, NYSE: DEO
Diageo combines spirits brands including Johnnie Walker, Smirnoff and Don Julio with Guinness. Its August 6 full-year results showed organic net sales down 2%, consisting of a 0.4% volume decline and a 1.6% unfavorable price/mix effect. Free cash flow increased to approximately $3.2 billion, according to its annual report.
AB InBev, NYSE: BUD
AB InBev owns an international portfolio including Budweiser, Stella Artois and Michelob Ultra. Its July 30 second-quarter results reported organic revenue growth of 5.6%, beer volume growth of 1.1% and no-alcohol beer revenue growth of 27%, as disclosed in its SEC filing.
Brand ownership matters: Constellation holds the exclusive U.S. rights to Corona and Modelo, and AB InBev's international exposure should not be confused with Constellation's U.S. business. “Organic” generally removes currency effects and changes in business ownership, although definitions differ. The reports also cover different fiscal periods and are not a perfectly standardized ranking.
Non-alcoholic products and luxury demand
A consumer who switches to alcohol-free beer may continue buying from the same producer, but rapid growth in a small business may not offset weakness in the larger alcohol business. AB InBev reported no-alcohol beer revenue up 27% globally and growth in the mid-thirties in its U.S. portfolio, led by Michelob Ultra Zero. Diageo said non-alcoholic products had reached 17 markets, up from 15; Guinness 0.0 delivered double-digit volume and net sales growth in Great Britain.
Molson Coors' September 18 announcement outlined a nationwide U.S. rollout of Coors 0.0 and expanded national distributor availability for Naked Life in 2027. Boston Beer announced Samuel Adams Non-Alcoholic Octoberfest in its fall lineup announcement. Planned distribution and product launches are not achieved sales or material earnings contributions. Ready-to-drink products can contain alcohol, so canned-cocktail growth is not automatically alcohol-free growth.
Luxury alcohol follows a different demand cycle. LVMH's January 2026 shareholder letter reported a 1% decline in group organic revenue and a 9% fall in recurring operating profit for 2025. Its first-half update reported wines and spirits organic revenue growth of 5% and recurring operating profit growth of 11%, while fashion and leather-goods organic revenue fell 1% over the half but grew 1% in the second quarter. These are divisional figures, not standalone Louis Vuitton sales.
The market-data snapshot showed Ralph Lauren trailing-year sales growth of 14.7% and Tapestry growth of 14.2%; their shares gained approximately 15.0% and 2.4%, respectively. Those figures provide premium-spending context but are not a benchmark for every luxury category. Relevant alcohol factors include Chinese demand, tourism, travel retail, gifting, discounting and the mix between expensive and lower-priced bottles.
Why the selloff is not the thesis
A hypothetical stock falling from $100 to $30 is down 70%, but a later fall to $10 would be a 90% decline from the original high and another 66.7% loss for the buyer at $30. Valuation can also remain unchanged after a selloff: a stock falling from $200 to $40 while earnings fall from $10 to $2 still trades at 20 times earnings.
The October 9 snapshot placed Boston Beer approximately 87.4% below its historical high, Brown-Forman 67.9% below and Molson Coors 66.8% below. Boston Beer nevertheless had the highest forward earnings multiple among the five companies with that estimate available.
Molson Coors traded at $37.20, or 7.8 times forward earnings, 5.3 times trailing free cash flow and 6.3 times enterprise value to EBITDA. Constellation traded at $122.64, with a trailing P/E of 11.0 and price/free cash flow of 11.3. Its fiscal 2027 comparable EPS guidance of $11.20 to $11.90 implies approximately 10.6 times earnings at the $11.55 midpoint.
Diageo traded at $86.73, with forward P/E of 12.2 and price/free cash flow of 15.1; its trailing P/E was approximately 28.0. Brown-Forman traded at $26.39, with forward P/E of 15.4 and price/free cash flow of 13.2. AB InBev traded at $77.33, with forward P/E of 15.7, price/free cash flow of 9.9 and enterprise value to EBITDA of 9.4. Boston Beer traded at $170.51, with forward P/E of 16.8, price/free cash flow of 8.5 and enterprise value to EBITDA of 7.9.
P/E, price/free cash flow and enterprise value to EBITDA measure different claims and assumptions. EBITDA does not deduct capital spending needed to maintain the business. Molson Coors' trailing loss includes its approximately $3.65 billion goodwill impairment in the third quarter of 2025. Boston Beer's 2026 guidance forecasts a GAAP loss of $4.23 to $6.23 per share versus adjusted earnings of $8.50 to $10.50 after excluding supplier litigation effects. Diageo's EPS before exceptional items was approximately twice reported EPS. Its U.S. depositary shares represent four ordinary shares each, as explained in its ADR FAQ.
Molson Coors' historical cash-flow yield was approximately 19.0%, versus approximately 15.7% using its 2026 underlying free cash flow guidance midpoint of $1.1 billion divided by snapshot equity value of $6.99 billion. Constellation's comparable figures were approximately 8.9% historically and 8.0% using fiscal 2027 guidance of $1.65 billion divided by $20.75 billion. These are not promised returns or dividend yields. A hypothetical 20% reduction in the earnings assumptions would raise Molson Coors' multiple from 7.8 to 9.7, Constellation's from 10.6 to 13.3 and Boston Beer's from 16.8 to 21.0.
Market reactions and what to watch
A declining industry does not automatically support a short thesis. Markets compare results with expectations, so falling sales can accompany a rally if investors expected worse results. Performance should be measured over identical dates and trading-session counts, with guidance, demand, cash flow and peer reactions assessed together.
Molson Coors and Diageo released results before the U.S. regular session on August 6, 2026. From August 5 closes, Molson Coors gained 1.3% after one session, declined 0.7% after five and was down 11.2% through October 9. Diageo gained 4.9%, 6.3% and was down 1.9%, respectively. SPY declined 0.2%, gained 0.4% and gained 1.1%. The figures were calculated from historical closing prices for TAP, DEO and SPY, exclude dividends and use August 5 as the baseline.
Both alcohol stocks initially rose but later fell below their pre-report prices, while the broader market was slightly higher. Diageo also held a capital-markets day on August 6, and Molson Coors left the S&P 500 effective September 21, according to S&P Global. These developments belong in the interpretation; they do not establish that changing drinking habits caused every subsequent move.
Diageo remained in a long-term technical downtrend despite recovering from its 2026 low. After peaking near $198 in early 2022, it traded around $87, below a declining 20-month EMA near $94. The $93-$95 zone was the first recovery test, $100-$107 a larger resistance area and $72-$76 a downside reference zone. These price zones are approximate and are not trading instructions.
Constellation reported after the close on October 6. Over the next three U.S. sessions it gained 6.0%, from $115.67 to $122.64, leading the basket. AB InBev and Diageo each gained approximately 2.3%; Molson Coors gained 0.8%; Brown-Forman 0.2%; Boston Beer 0.1%; and SPY declined approximately 0.1%. The calculations use linked histories for STZ, BUD, DEO, TAP, BF.B, SAM and SPY. Dividends are excluded. Constellation's report also included the acquisition of ready-to-drink brand SpikedAde, so the period reflected more than quarterly results alone.
The next useful evidence is not simply whether a share price rebounds. It is whether depletions, retail sales, repeat demand, pricing, product mix, margins, free cash flow, debt and forward earnings expectations stabilize. For a bearish thesis, repeated failure to participate in peer rallies, weaker guidance or worsening demand would be relevant; stronger demand and persistent outperformance would weaken that interpretation. Short sellers must also account for borrowing costs, dividend payments and theoretically unlimited losses, as described in the SEC's short-selling bulletin.
Neither buying nor shorting is answered by the distance from an old high. The central question is what level of future earnings the current price can reasonably support and what evidence would change that assessment. Educational analysis only. Trading and investing involve risk of loss.

