Cardano, XRP and Injective Trade Near Key Levels on July 24
Key Takeaways
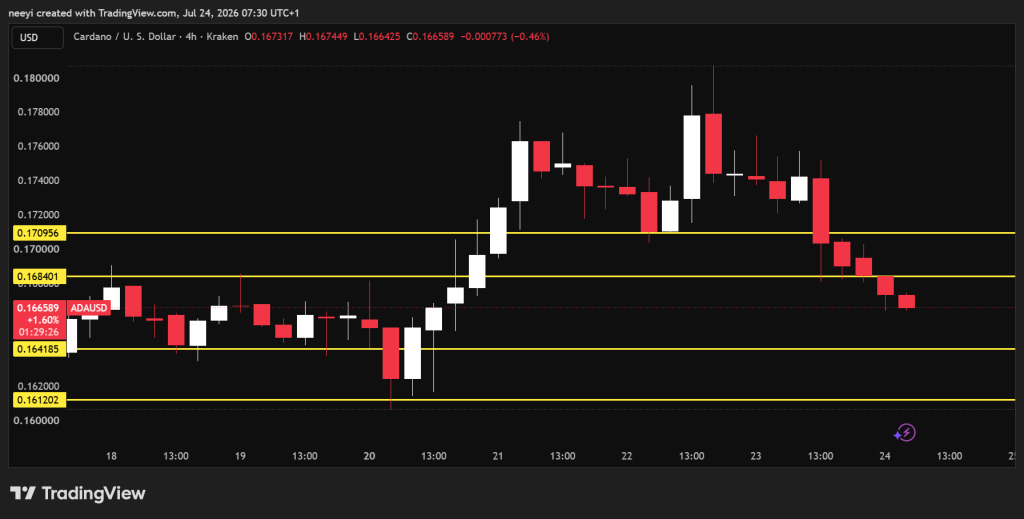
- •Cardano declined across four consecutive 4-hour sessions to approximately $0.166, with RSI, Stochastic Oscillator, and Ultimate Oscillator all generating sell signals.
- •XRP remained in a tight consolidation phase between $1.10 and $1.11 after losing support near $1.10, with technical indicators producing mixed signals.
- •Coinbase completed the final stage of Injective's native token migration, enabling direct deposits, withdrawals, and trading on the Injective network without Ethereum bridges.
- •Injective rallied from about $5.17 to an intraday high near $5.60 before easing to around $5.38, supported by multiple buy signals including RSI at 64.167 and MACD at 0.035.
- •Each token faces defined price scenarios where a breakout above resistance or a breakdown below support could determine the next significant price movement for the session.
Crypto prices entered another closely watched trading session on July 24, with several major tokens testing levels that may shape their short-term direction before the end of the day. Cardano remained under pressure after a steady decline, XRP continued to trade within a tight range, and Injective attempted to hold gains following new ecosystem developments.
The levels are notable because a breakout or breakdown could alter the near-term technical setup. Current indicators also show where buyers and sellers appear to hold an advantage across ADA, XRP and INJ.
Cardano Trades Near Key Support Levels
Cardano (ADA) has declined across the past four consecutive 4-hour trading sessions. ADA recently traded around $0.166 after sellers remained in control during the latest sessions.
For today’s session, the nearest trading range appears to be between $0.164 and $0.168, assuming neither buyers nor sellers gain a stronger advantage. A move below $0.164 could open the way for a decline toward $0.161, while a recovery above $0.168 could allow Cardano to test the $0.170 area before the trading day ends.
Cardano is a decentralized smart contract platform for building decentralized applications, or dApps. The network emphasizes a research-driven and methodical approach with its Ouroboros proof-of-stake system and eUTXO model, prioritizing long-term stability and sustainability. Ethereum, after transitioning to proof of stake, focuses on a modular architecture with the Ethereum Virtual Machine and a community-driven governance process through Ethereum Improvement Proposals, or EIPs.
The Relative Strength Index currently reads 42.497, generating a sell signal. RSI measures the speed and strength of recent price movements. Readings below 50 generally indicate that sellers still control the short-term direction, although the market has not moved into oversold territory.
The Stochastic Oscillator stands at 25.643 and also gives a sell signal. The indicator compares the latest closing price with the recent trading range. Lower readings typically show that buying pressure has weakened.
MACD remains one of the few positive technical signals for ADA. Its reading of 0.001 produces a buy signal, as the indicator compares two moving averages to identify possible changes in market direction. However, the reading remains close to zero, indicating that bullish momentum is still limited.
The Ultimate Oscillator is at 32.587 and continues to show a sell signal. This indicator combines short-, medium- and longer-term periods to measure buying pressure across different market conditions.
Cardano (ADA) Price Scenarios for Today
Bullish scenario: A move above $0.168 could send ADA toward $0.170.
Neutral scenario: Cardano continues trading between $0.164 and $0.168 for most of today’s session.
Bearish scenario: A break below $0.164 could push ADA down to around $0.161.
XRP Remains Between Major Support and Resistance
XRP continues to trade within a narrow range after losing support near $1.10. Buyers have not managed to reclaim the next resistance area around $1.11, leaving XRP in a consolidation phase.
A successful move above $1.11 could allow XRP to climb toward $1.13 today. A decline below $1.10 could send the price closer to $1.08 if selling pressure increases.
XRP and Cardano serve different purposes, so whether one is considered “better” depends on user goals. XRP is a specialized payment network for institutional money transfers, while Cardano is designed as a broader smart contract platform.
RSI currently reads 45.176, producing a neutral signal. The indicator tracks price strength and momentum, and the current reading suggests that neither buyers nor sellers have established a clear advantage.
The Stochastic Oscillator stands at 25.564 and gives a sell signal. The reading shows that XRP remains close to the lower end of its recent trading range.
MACD continues to produce a buy signal with a reading of 0.001. This indicator compares fast and slow moving averages to identify potential trend changes. The positive reading indicates that buyers still have an opportunity to regain control if the price moves above resistance.
The Ultimate Oscillator currently stands at 41.091 and gives a sell signal. The indicator evaluates buying pressure across multiple periods and currently points to weaker market strength.
XRP Price Scenarios for Today
Bullish scenario: A move above $1.11 could send XRP toward $1.13.
Neutral scenario: XRP continues trading between $1.10 and $1.11 through today’s session.
Bearish scenario: A decline below $1.10 could push XRP toward $1.08.
Injective Holds Gains After Coinbase Native Network Integration
Injective (INJ) recently traded around $5.38 after recording a strong rally during the latest 4-hour trading session. INJ climbed from about $5.17 to an intraday high near $5.60 before easing slightly.
Part of the move followed an ecosystem update. Coinbase completed the final stage of Injective’s native token migration and officially enabled direct deposits, withdrawals and trading on Injective’s native network. The update removes the need for Ethereum bridges and gives both retail and institutional users direct access to the Injective ecosystem.
Current support and resistance levels remain close together, between $5.29 and $5.47. A move above $5.47 could allow INJ to test around $5.61, while a decline below $5.29 could send Injective toward $5.14.
RSI currently reads 64.167 and produces a buy signal. RSI measures the pace of recent price changes. Readings close to 70 usually indicate that buyers remain active, although extremely high values can signal an overheated market.
The Stochastic Oscillator stands at 40.483 and gives a sell signal. This indicator compares the latest closing price with the recent trading range. The current reading shows that the latest rally has slowed after reaching today’s high.
MACD stands at 0.035 and continues to generate a buy signal. The indicator compares two moving averages and currently points to positive short-term momentum.
The Ultimate Oscillator records 60.029 and also gives a buy signal. This indicator combines several trading periods into one reading and currently points to stronger buying pressure than selling pressure.
As with other crypto assets, INJ carries general risks, including short history risk, volatility risk, liquidity risk, demand risk, forking risk, cryptography risk, regulatory risk, concentration risk, electronic trading risk and cyber security risk.
Injective (INJ) Price Scenarios for Today
Bullish scenario: A move above $5.47 could lift INJ toward $5.61.
Neutral scenario: Injective continues trading between $5.29 and $5.47 during today’s session.
Bearish scenario: A decline below $5.29 could send INJ down to around $5.14.

