AAVE Holds Near $101 After Trendline Break, With Bulls Eyeing $125 Recovery Zone
Key Takeaways
- •AAVE traded near $101 after moving above a multi-month descending trendline and reclaiming its 21-day and 50-day moving averages.
- •Analysts said the $100 to $103 range is the key near-term zone that will likely determine whether the breakout holds.
- •If buyers maintain control above that area, cited resistance targets include $125 and $140 in the short to medium term.
- •Chart watchers noted that AAVE’s rebound followed a recovery from June lows and a period of higher lows after earlier weakness.
- •Longer-term resistance levels highlighted on higher-timeframe charts include about $142.53, $176.44 and $212.16.
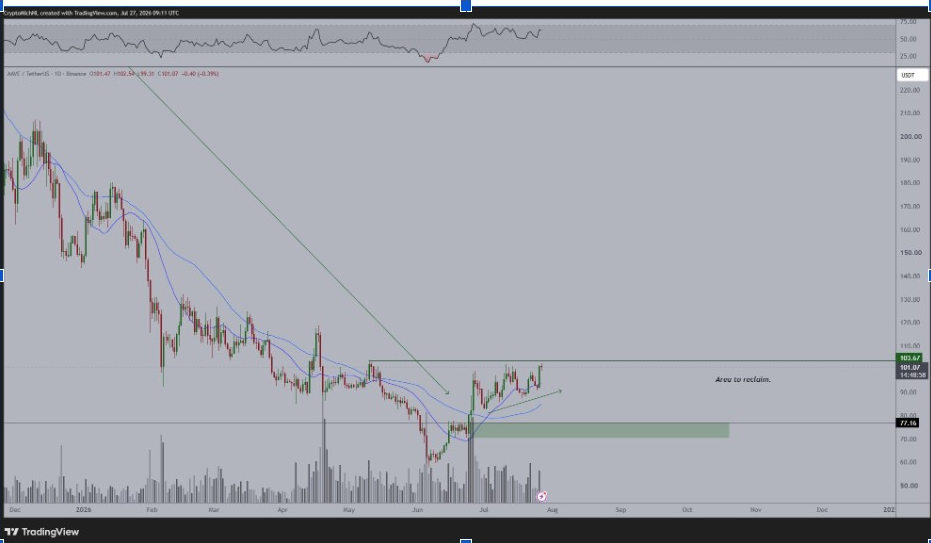
AAVE traded near $101 after breaking above a multi-month descending trendline, a move that followed a rebound from June lows and lifted the token back above several key moving averages. While the breakout has improved the short-term technical picture, analysts said further gains will depend on AAVE sustaining trading above the breakout zone, especially as price approaches nearby resistance levels that have already attracted seller interest.
Several market watchers are now focused on the $100 to $103 area as the key zone that could determine the next directional move. If buyers continue to defend that range, the next resistance levels cited by analysts are $125 and $140.
AAVE Price Escapes Its Long-Term Downtrend
AAVE traded near $101 after reclaiming both the 21-day and 50-day moving averages. Crypto analyst Michael van de Poppe said AAVE is one of the few altcoin charts beginning to show a possible shift from a downtrend to an uptrend.
For several months, sellers had controlled the market and repeatedly pushed AAVE into lower highs. The latest rebound pushed the token above the descending resistance line, suggesting that the previous bearish structure is starting to weaken.
The $100 level is now a key psychological area for buyers to defend. A failure to hold that mark could cause the breakout to fail. If AAVE remains above that zone, former resistance may start acting as support and give bulls a stronger base for another move higher.
Van de Poppe placed the next major resistance near $125. If buyers clear that level, AAVE could continue toward $140, although sellers may become more active in that area because of earlier price reactions.
Rectangle Pattern Supports Another Move
Crypto With Gopal highlighted a rectangle pattern that formed after AAVE’s sharp recovery from the June low. Price has continued to trade within a defined range while buyers repeatedly absorb selling pressure near the upper boundary.
That setup puts immediate resistance around $103, just above the current market price. A decisive move above that barrier, combined with stronger trading volume, could confirm the next stage of the recovery.
AAVE previously fell toward $60 before buyers stepped in and began rebuilding the market structure. Since then, the token has formed a series of higher lows, and each pullback has attracted renewed demand.
Price is also holding above its short-term moving averages, which supports the bullish setup. Still, rejection at $103 could keep AAVE inside the rectangle and extend the consolidation before another breakout attempt develops.
Trendline Break Shifts the Market Structure
Ece Vortex also pointed to AAVE’s move above a multi-month resistance trendline. The breakout follows a long sequence of lower highs, making the latest price action a notable shift in the balance between buyers and sellers.
The daily chart shows AAVE crossing the descending line around the $100 region. If buyers keep the price above the former resistance, the token could gradually move toward previous supply areas near $120 and $130.
The recovery also follows strong buying activity around the June accumulation zone. After the token hit its lowest levels, demand returned, and that support helped AAVE recover a significant portion of the losses.
AAVE Crypto Recovery Path
Ömer identified a possible bottoming structure on a higher timeframe, supporting a broader recovery outlook. His chart highlighted several resistance zones that could become relevant if AAVE clears its immediate technical barriers.
The first major level is near $142.53, followed by additional resistance at $176.44 and $212.16. These levels represent longer-term resistance areas on the chart, while the near-term focus remains on whether AAVE can keep the breakout intact above the $100 region.
This article is for informational purposes only and does not constitute financial or investment advice. Technical analysis, chart patterns and analyst projections do not guarantee future AAVE price performance. Cryptocurrency markets remain highly volatile, and readers should conduct independent research before making investment decisions.

