イーサリアム価格は2,500ドル付近を維持、トレーダーは2,550ドルの抵抗線と3,000ドル目標を注視
重要ポイント
- •Ethereumは8月の多くの期間を保っていた1,875ドル〜1,950ドルのレンジを上抜け、その後も2,500ドル付近を維持した。
- •スポットEthereum ETFは8月21日終了週に約6億9,720万ドルの純流入を記録し、2026年で最も強い週次流入となった。
- •約30億ドル相当のレバレッジを使った暗号資産ポジションが24時間以内に清算され、その約92%をショートが占めた。
- •CoinGlassは2,545ドル〜2,555ドル付近に大きな清算クラスターを示し、下方では2,410ドル〜2,420ドル付近に流動性ゾーンが見られた。
- •アナリストのCrypto Patelは、イーサリアムが過去の半減期後サイクルに似た蓄積局面にある可能性を指摘したが、その見通しは長期的なブレイクアウト維持に依存している。
Ethereum price remained near $2,500 after breaking out of its August consolidation range, following a sharp recovery from the mid-August trading band. ETH reached an Aug. 27 high near $2,560 before easing back toward the $2,500 area.
The move came after Ethereum broke out of the $1,875-$1,950 range that had contained the token through much of August. ETF inflows, short covering, and broader strength across the crypto market supported the advance, although ETH now faces resistance near $2,550-$2,560.
Ethereum Price Tests Resistance Near $2,550
Ethereum traded around $2,500 after moving above the $1,875 to $1,950 range that had held throughout much of August. Buyers also pushed ETH above resistance linked to the February-to-May trading range. The price has since stayed near $2,500, preserving the breakout as the market waits for the next directional move.
The ETH daily chart showed stronger buying pressure than selling pressure during the latest move. The next daily levels were near $2,656 and $2,812, with $2,969 also appearing as a higher resistance level on the same setup.
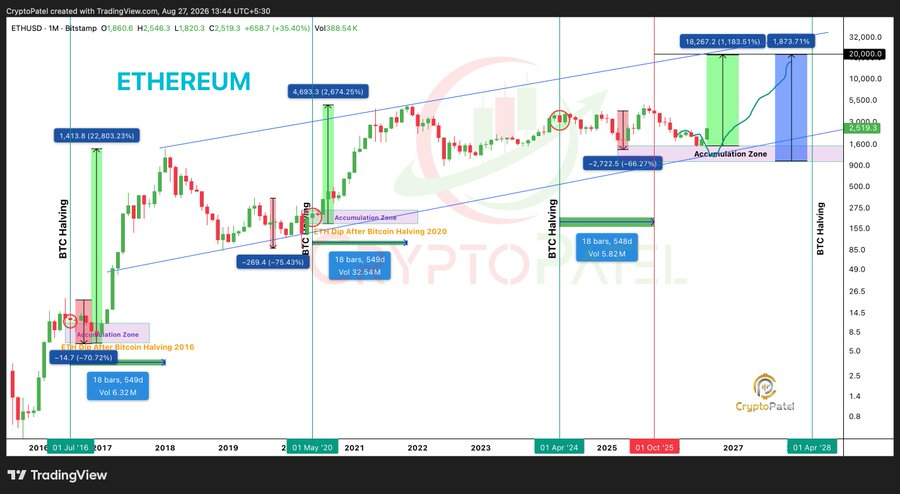
Analyst Crypto Patel has also pointed to Ethereum's current structure as a possible repeat of previous post-Bitcoin-halving cycles. In that view, ETH is moving through an accumulation phase ahead of earlier major price advances, with similar consolidation patterns seen across prior cycles. That framing rests on Bitcoin's halving cadence, which cuts new BTC issuance in half roughly every four years and most recently occurred in April 2024, the timeline analysts commonly use when dating multi-year crypto market cycles.
Crypto Patel's analysis suggests that a breakout from the current accumulation zone could open the door to a larger upward move. The Ethereum price prediction in that framework projects a potential target above $20,000 if the historical pattern continues. However, that outlook still depends on Ethereum maintaining its long-term breakout structure and broader market conditions.
ETF Inflows and Short Covering Support Ethereum
U.S. spot Ethereum ETFs, which launched in July 2024 and hold ETH directly rather than futures contracts, recorded about $697.2 million in net inflows during the week ending Aug. 21, marking their strongest weekly inflow performance of 2026. Bitcoin and Ethereum funds together attracted roughly $2.6 billion over the same period. Continued ETF demand added support to the spot market after ETH recovered from its August consolidation. Because issuers publish flow figures daily and weekly, ETF inflows and outflows have become one of the most widely tracked gauges of institutional participation in ETH.
The U.S. Treasury also raised planned long-end bond buybacks, operations in which the Treasury repurchases outstanding longer-dated securities, from $2 billion to $4 billion per operation starting Sept. 9, which improved liquidity conditions for markets. The Sept. 9 start of the larger operations and the next round of weekly ETF flow reports are among the scheduled data points traders can watch in the weeks ahead.
In addition, nearly $3 billion in leveraged crypto positions were liquidated within 24 hours, and short positions accounted for about 92% of the total. Ethereum price gained roughly 18% during that move as bearish traders closed positions, adding buying pressure to the market. Liquidations occur when exchanges force-close leveraged positions that no longer meet margin requirements, and closing a short requires a buy order, which is why forced short closures add demand during fast-moving markets.
Ethereum Faces Liquidity Cluster Above $2,500
On the four-hour chart, ETH traded above the Bollinger Band midpoint near $2,477; the bands are a widely used moving-average and volatility indicator on intraday charts. The upper band was around $2,514, while the lower band stood near $2,441. A move above the upper band would shift attention to the $2,550 area, while a break below the midpoint could bring the lower band into focus.
CoinGlass, a crypto derivatives analytics platform, showed a dense liquidation cluster around $2,545 to $2,555. Another major liquidity area appeared near $2,410 to $2,420 below the market. Such clusters mark price zones where forced liquidations would concentrate, one reason derivatives trackers flag them as potential volatility pockets. Ethereum price could test either zone as leveraged positions build, while the $2,343 level and $2,187 pivot remain support points.
