ビットコイン、短期保有者の取得価格を回復 50週移動平均は81Kドル付近で維持
重要ポイント
- •Bitcoinは8月に25%以上上昇し、2017年以降で最良の8月成績を記録する勢いにある。
- •BTCは8月19日に67,125ドルのShort-Term Holder Realized Priceを上抜け、その後も維持している。
- •この価格帯の取得価格を明確に回復したのは2025年4月以来で、約10か月ぶりとなる。
- •Bitcoinは今週81,265ドルに達したが、81,063ドルの50週移動平均を下回って引けた。
- •短期的な構図は改善したが、より広いトレンドを変えるには50週移動平均を週足で上抜けて維持する必要がある。
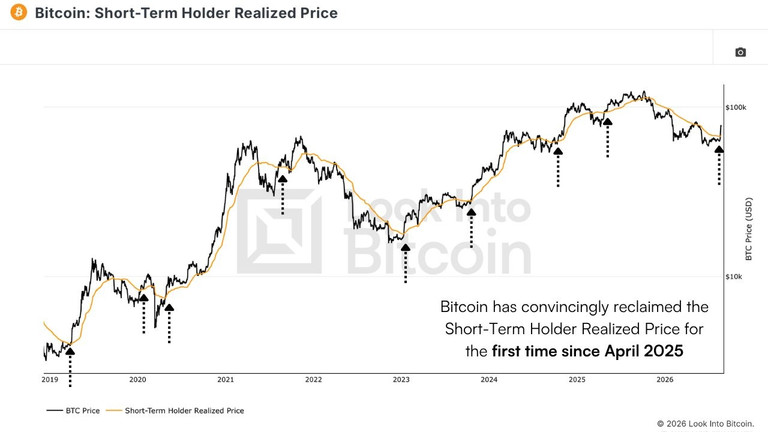
Bitcoin is on track for its best August return since 2017, having gained more than 25% so far, according to CoinGlass. The entire move has unfolded over the past 10 days, with BTC rising from $62,000 on August 17 to a high of $81,000 on August 25 and now trading in the $78,500 area. During that advance, on August 19, the price moved above the Short-Term Holder Realized Price at $67,125 and has remained above it since. Data from Look Into Bitcoin shows this is the first convincing reclaim of that level since April last year.
The Short-Term Holder Realized Price is an on-chain metric that tracks the average cost basis of coins that last moved within the past 155 days. In practical terms, it reflects what recent buyers paid on average. When Bitcoin trades below this line, those holders are underwater and often sell into rallies in an effort to break even. That dynamic can help explain why bear-market bounces often stall. When price moves back above the line, those same buyers are sitting on unrealized gains, and the level can shift from resistance to support.
At the time of writing, Bitcoin is about 17% above the short-term holder cost basis. BTC briefly tested this level in May but was rejected, making this the first time in more than a year that price has maintained a meaningful buffer above it before any invalidation could be considered. That matters because this cohort often provides the first layer of overhead supply during weak recoveries, and a sustained move above their average entry price reduces the amount of forced selling pressure that can appear on minor pullbacks.
Ten Months Below the Line and Recent Buyers Are Finally in Profit
The last time the short-term holder cost basis was convincingly reclaimed was in April 2025, a few weeks after Bitcoin bottomed near $75,000 during the tariff selloff. Bitcoin stayed above that line through the summer, then broke decisively below it after the October 10 liquidation cascade. Every attempt to move back above it failed until last week. That means recent buyers spent roughly ten months holding coins worth less than they paid, with that supply repeatedly hitting the bid on every rally attempt. The clearest example was the failed attempt in May.
Historically, reclaims of this level have tended to cluster around turning points rather than appear in the middle of a trend. The Look Into Bitcoin chart highlights examples during the 2019 recovery, the March 2020 crash, mid-2021, the late-2022 lows, and again through 2024. Even so, it is easier to identify those reclaims in hindsight than to trade the current one, and the sample across a full market cycle remains small.
The immediate takeaway is behavioral. A group that was selling relief rallies four weeks ago is now sitting on paper gains, which changes how that cohort may react on the next 5% decline.
The 50-Week Moving Average at $81K Is Still Rejecting Price
Bitcoin reached $81,265 this week. The 50-week moving average stands at $81,063. Price touched that line and closed about $2,300 below it.
This moving average has a long record on the weekly chart. It supported price throughout the 2024 and 2025 advance, catching pullbacks repeatedly. After BTC lost it in November 2025, the relationship reversed. The same line rejected price in 2018 and again through 2022, both of which were multi-quarter downtrends.
The slope matters as much as the level itself. The 50-week moving average has been falling since the November breakdown and is still declining now. In a bear structure, a tag and rejection of a downward-sloping long-term average is standard behavior. It does not signal a trend change until the slope flattens.
What Would Change the Bigger Picture
Two different timeframes are telling two different stories, and both can be true at once. The short-term trend has improved, with recent buyers back above water and the $67,125 area now more likely to act as support on any pullback.
The longer-term trend has not changed. That would require a weekly close above $81,063, followed by the average turning sideways rather than continuing lower. Until that happens, this week’s high remains a rejection at a known resistance area, and the reclaim of $67,000 is the only structural change visible in the chart.
Don’t just read crypto news. Understand it. Subscribe to our newsletter. It’s free.
