Gli utili di Microsoft mettono alla prova i rendimenti della spesa AI mentre emerge un pattern grafico ribassista
Punti chiave
- •Il consensus prevede per il quarto trimestre fiscale 2026 di Microsoft un EPS di circa 4,21 dollari su ricavi di circa 87,6 miliardi di dollari.
- •Microsoft ha detto che il run rate dei ricavi annuali del suo business AI ha superato i 37 miliardi di dollari nel terzo trimestre, con un aumento del 123% su base annua.
- •Microsoft aveva indicato in precedenza circa 190 miliardi di dollari di spese in conto capitale nel 2026 e ha detto di attendersi vincoli di capacità almeno fino al 2026.
- •Deutsche Bank ha stimato che il free cash flow del quarto trimestre potrebbe diminuire del 34,2% su base annua, a 16,8 miliardi di dollari.
- •Il grafico settimanale di Microsoft ha formato un pattern ribassista Head and Shoulders, con 413.60 come resistenza e 341.43 come principale supporto della neckline da monitorare.
Microsoft’s fiscal Q4 2026 earnings will put its large artificial intelligence investment cycle under scrutiny, with traders focusing on Azure growth, Copilot monetisation, free cash flow and forward guidance rather than headline EPS or revenue alone.
The company’s capital spending remains the key variable. Microsoft’s capex-to-revenue ratio has climbed to a record high among the Magnificent 7, and any further increase in AI spending without clear evidence of stronger monetisation could pressure sentiment even if the company beats estimates.
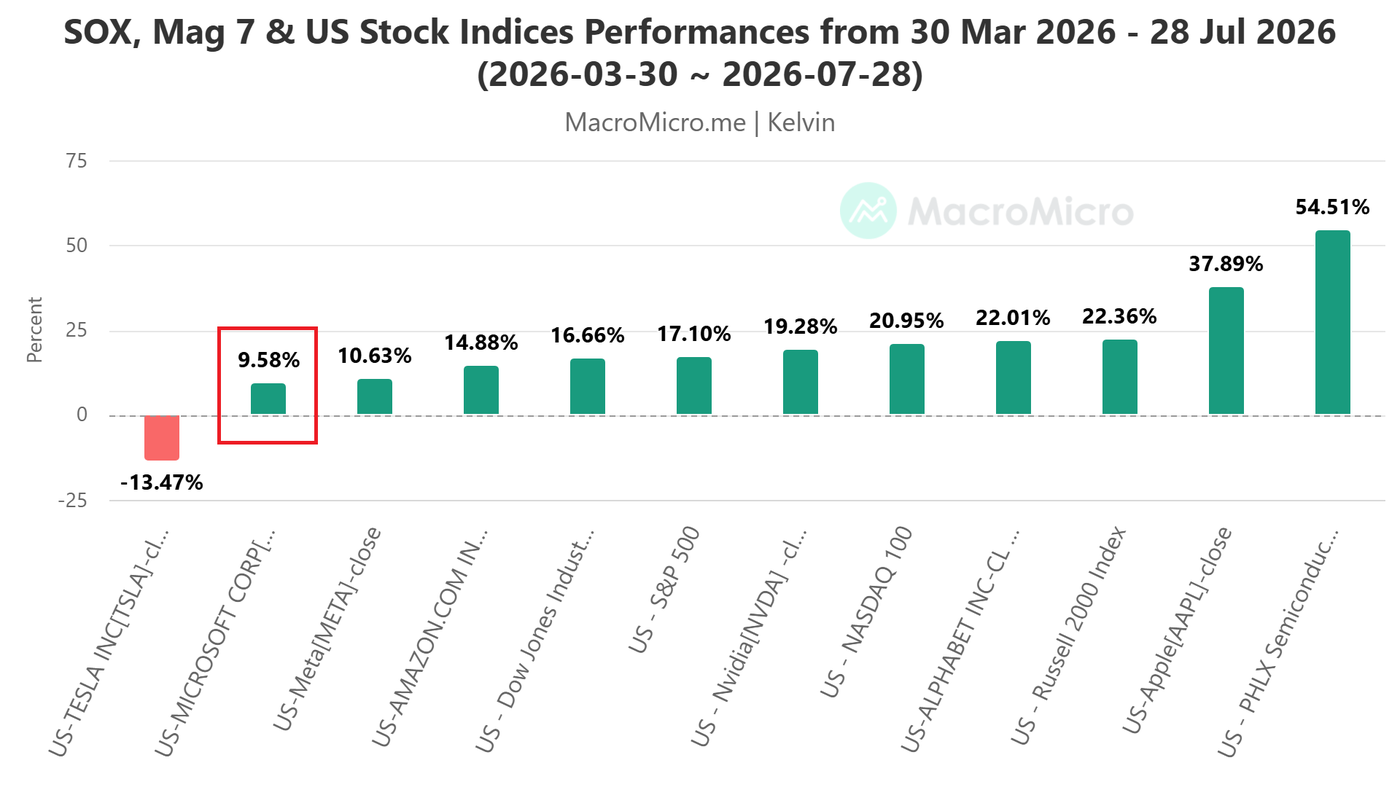
Microsoft has also lagged other AI beneficiaries during the latest market rally. Semiconductor stocks have benefited more directly from hyperscalers’ AI infrastructure spending, raising questions about how quickly Microsoft’s own investments are showing up in reported growth and cash generation.
Ahead of the after-hours report on 29 July 2026, consensus expects Microsoft to post earnings per share of about $4.21 on revenue of roughly $87.6 billion. Market participants are treating the release as a test of whether Microsoft can turn its heavy AI infrastructure buildout into durable Azure growth, Copilot monetisation and operating leverage.
Investors focus on AI monetisation
Traders will be watching for signs of stronger monetisation from Microsoft 365 Copilot, Azure AI Services, GitHub Copilot, OpenAI-related workloads and broader enterprise AI adoption.
Microsoft said its AI business annual revenue run rate surpassed $37 billion in Q3, up 123% year on year. S&P Global noted that consensus expects Azure AI Services revenue of about $23.7 billion for FY2026.
Those figures matter because they offer one of the clearest ways to gauge whether Microsoft’s AI spending is translating into broad commercial uptake rather than just higher infrastructure outlays.
Capex and free cash flow remain the main risk
Capital expenditure is arguably the biggest swing factor. Microsoft previously guided to around $190 billion in calendar 2026 capital expenditure, including about $25 billion tied to higher component pricing, and said it expects to remain capacity-constrained through at least 2026.
MarketWatch reported that investors are examining whether this level of AI spending is producing sufficient returns, while Deutsche Bank estimated Q4 free cash flow could decline 34.2% year on year to $16.8 billion.
In calendar Q1 2026, Microsoft’s capex-to-revenue ratio continued rising to 37.25, the highest among the Magnificent 7 hyperscalers, from 24.97 in calendar Q3 2025. That increase suggests Microsoft faces a higher hurdle in generating revenue and free cash flow from its AI-related fixed asset investments.
A capex increase without clear monetisation would be viewed negatively, even if headline earnings come in ahead of expectations.
Bearish technical picture develops
From a technical perspective, Microsoft’s weekly chart has formed a major bearish Head & Shoulders topping pattern, accompanied by a declining Chaikin Money Flow reading. Those signals suggest the major uptrend that began from the 4 November 2022 low may be at risk of reversing.
The stock’s 1% rebound on Tuesday, 28 July 2026, stalled after a retest of the 50-day moving average. Microsoft has traded below that average since 9 June 2026, indicating a lack of medium-term bullish momentum.
Traders are watching 413.60 as key medium-term resistance. A break below 372.10 in the near term would expose support at 355.74 and then 341.43, which is the major neckline support of the Head & Shoulders pattern.
On the other hand, a daily close above 413.60 would undermine the bearish setup and could open the way for a move back toward 431.60, which also aligns with the 200-day moving average.
Opinions are the authors’ and do not necessarily reflect those of OANDA Business Information & Services, Inc. or any of its affiliates, subsidiaries, officers or directors. This publication is provided for informational and educational purposes only. For more information, see the MarketPulse Terms of Use and MarketPulse. © 2026 OANDA Business Information & Services Inc.

