Predicción del precio de SUI para 2026-2032: ¿Es SUI una buena inversión?
Puntos clave
- •SUI remains below its 50-day and 200-day simple moving averages, indicating a bearish daily trend.
- •On July 27, SUI fell 1.56% over 24 hours while trading volume increased 56.15% to $182 million.
- •The Sui blockchain has handled nearly $65 billion in stablecoin transactions since June 10 after fees on stablecoin transfers were removed.
- •The forecast puts SUI in a 2026 range of $0.68 to $2.07, with a projected high of $2.07 by year-end.
- •The article says SUI’s longer-term outlook depends on adoption, scaling, token unlock pressure, and competition with Solana and Ethereum Layer 2s.
Key takeaways:
Our SUI price prediction indicates a high of $2.07 by the end of 2026.
In 2028, SUI will range between $10.47 and $12.10, with an average price of $10.83.
In 2031, it will range between $33.01 and $40.39, with an average price of $34.20.
Our SUI price prediction points to a high of $2.07 by the end of 2026, an average price of $10.83 in 2028, and a potential average of $34.20 by 2031. For investors, traders, or crypto enthusiasts evaluating SUI’s future upside and investment potential, this forecast reviews the data that matters: historical price action, technical indicators, short- and long-term projections from 2026 to 2032, market sentiment, recent news, and whether SUI looks like a good investment. In a volatile market, understanding SUI’s likely price path and the network developments shaping it can help inform decisions over the next few years.
Overview
SUI price prediction: Technical analysis
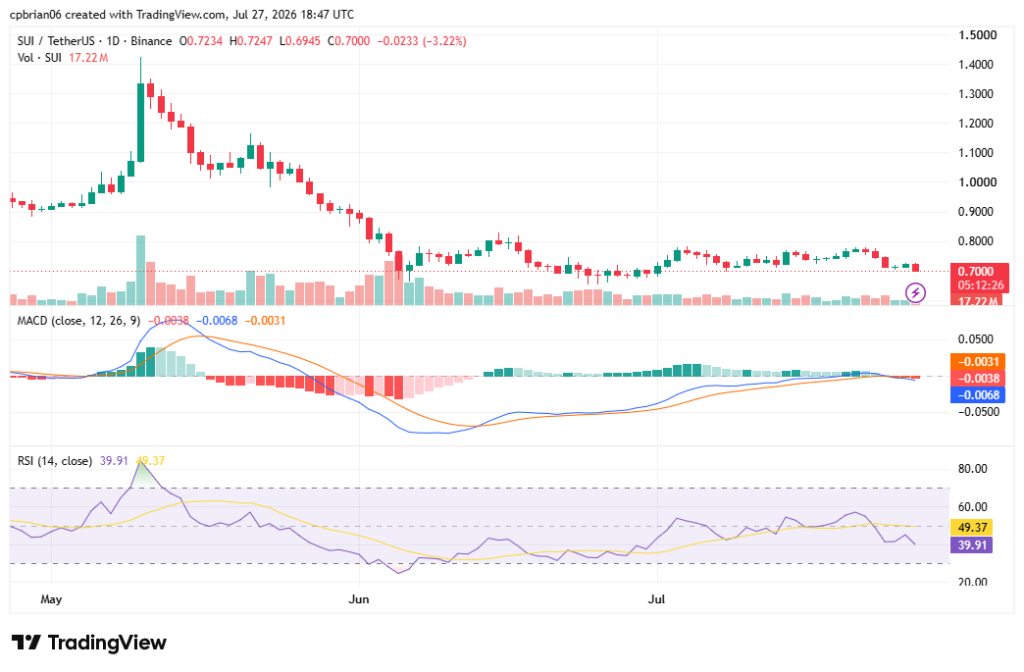
SUI remains below its 50-day and 200-day simple moving averages, indicating a dominant daily bearish trend. As with any forecast, technical factors should be considered alongside fundamental factors.
SUI price analysis
On July 27, SUI coin fell 1.56% over 24 hours and 0.10% over the past 30 days. Trading volume rose 56.15% to $182 million over 24 hours, signaling rising conviction in the trend, while short-term price action continued to track the broader cryptocurrency markets.
SUI 1-day chart analysis
SUI is neutral after facing resistance at $0.811. The candles are coherent, supporting the neutral reading. Technical support is in the $0.50 to $0.66 range. If bullish pressure resumes, SUI could test $0.80 and then $0.89.
SUI 4-hour chart analysis
SUI is volatile on this timeframe and is on its next leg down. Support and resistance are at $0.699 and $0.771, respectively. Its Relative Strength Index (RSI) is 34.17. It is considered oversold when the value falls below 30.
SUI technical indicators: Levels and action
Daily simple moving average (SMA)
Daily exponential moving average (EMA)
What to expect from the SUI price analysis next?
Short-term charts show negative momentum, while key technical indicators remain neutral unless a bullish continuation develops above nearby resistance. Next week’s price action depends on whether support at $0.699 holds.
Why is SUI down?
Sui’s decline closely mirrors Bitcoin’s drop, suggesting it traded as a high-beta asset during a broad market sell-off. The total crypto market cap fell 1.44% to $2.2 trillion.
Recent news
The Sui blockchain has processed nearly $65 billion in stablecoin transactions since June 10, following an update that eliminated fees for stablecoin transfers. The fee removal, aimed at simplifying B2B payments and retail use, has boosted transaction volumes and could challenge traditional payment systems such as SWIFT.
That usage matters because stablecoin flows often reflect how a network is being used beyond trading, giving developers and payment-focused users a reason to watch adoption metrics alongside price charts.
Will SUI reach $10?
According to the Cryptopolitan price prediction, SUI is expected to reach $10 in 2027, with an average price of $10.83 for the year.
Will SUI reach $100?
It remains unlikely that SUI will rise to $100 before 2032.
Will SUI reach $1,000?
It remains unlikely that SUI will rise to $1,000 before 2032.
How high can Sui go?
Per the Cryptopolitan price prediction, SUI could reach $4.77 by the end of 2026, while some long-term models place it in the $2.00 to $3.50 range under favorable ecosystem expansion and market recovery. Its long-term potential will also depend on how the network handles token unlocks, institutional adoption, and scaling execution.
Is SUI crypto a good investment?
If market sentiment improves, SUI could revisit previous highs. SUI’s price predictions for 2032 are optimistic as global adoption of decentralized applications rises, though the long-term upside also depends on how Sui competes with Solana and Ethereum Layer 2s and manages competitive risk.
The native token supports network economics, and the SUI token is used to pay gas and transaction fees, participate in governance, and support liquid staking, which can strengthen demand if usage improves and fresh capital follows continued innovation. Sui uses a delegated proof-of-stake model, where validators and delegators help secure the blockchain and earn rewards. Integrations with major tech frameworks expand developer access in SUI. Its architecture also emphasizes parallel execution, horizontal scaling, low-latency transactions, and deep composability.
Those features help explain why the network is often assessed not just as a speculative asset, but as a blockchain competing for developer activity, user retention, and payment use cases. In practice, the question for SUI is whether on-chain activity can keep broadening enough to support that role over time.
SUI price prediction July 2026
The SUI price forecast for July ranges from $0.65 to $1.10. Traders should watch whether support holds and momentum improves after the May range. The average price for the month will be $0.89.
SUI price prediction 2026
For 2026, SUI’s price will range between $0.68 and $2.07. Some analyst models place the end-2026 price between $1.20 and $1.50, depending on broader market cycles, while a stronger bull run would likely be needed to push SUI toward the upper end of that range as investors shift toward digital assets during changing macro conditions. Alternative long-range forecasts put Sui Crypto at $0.7545 by the end of 2026, $3.33 by 2030, and $5.32 by 2040, while some 2025 projections targeted $2.85 to $3.00 under favorable conditions. The average price for the year will be $1.77.
SUI price prediction 2027-2032
Sui price prediction 2027
SUI coin price prediction estimates a range of $10.47 to $12.10, with an average of $10.83.
Sui price prediction 2028
SUI network coin price prediction climbs even higher into 2028. According to the prediction, the SUI cost will range from $15.50 to $18.66, with an average of $16.04.
Sui price prediction 2029
According to the SUI forecast for 2029, the price of SUI will range from $22.96 to $27.04, with an average closing price of $23.77.
Sui price prediction 2030
According to the 2030 SUI price prediction, the price will range from $33.01 to $40.39, with an average of $34.20.
Sui price prediction 2031
The SUI crypto price forecast for 2031 is a maximum price of $57.09. It will reach a minimum price of $47.50 and an average price of $49.21.
Sui crypto price prediction 2032
The SUI price prediction ranges from $7.05 to $8.16, with an average of $7.24. The predictions indicate long-term growth.
SUI market price prediction: Analysts’ SUI price forecast
Cryptopolitan’s SUI price prediction
Our predictions show that SUI will reach a high of $2.07 in 2026, and future forecasts will depend not only on adoption and scaling but also on whether the native token captures value as ecosystem usage grows. In 2028, it will range between $10.47 and $12.10, with an average of $10.83. In 2030, it will range between $33.01 and $40.39, with an average of $34.20. Sustained capital inflows and higher on-chain usage would strengthen the long-term case.
If you plan to buy SUI or trade SUI, base that decision on your own research rather than headline targets alone. These predictions are not investment advice, and risk can also rise with supply growth if token unlock pressure persists. Seek independent consultation or do your own research.
SUI historic price sentiment
Exchanges such as Binance, OKX, KuCoin, and Bybit hosted activities toward the initial distribution of SUI in April 2023.
Sui was developed by Mysten Labs, the team behind the Layer-1 chain.
Its object-centric data model allows tracking of individual objects, and its architecture uses parallel execution to handle many transactions with low latency while maintaining efficient performance.
The Move programming language is used to create digital assets and smart contracts in a more secure environment.
Tools such as zkLogin and sponsored transactions make SUI easier for mainstream users by simplifying access and fees, while the design also supports deep composability.
The chain is built for high throughput, fast transactions, and real-world applications such as gaming and finance, with low-latency transactions, horizontal scaling as the network grows, and ongoing innovation that could support long-term value through sustained usage.
The SUI token is the native token used for fees, staking, and governance.
SUI initially traded at $2.10, well above the $0.10 investors paid during its public sale at the end of April.
A bear run preceded the listing, and on October 23, 2023, it fell to its lowest price, $0.3643.
It began recovering in November 2023.
It reached its highest price on March 27, 2024, at $2.18, following the Greek stock exchange’s announcement of a possible collaboration.
On May 21, 2024, the SUI network surpassed 1 million daily active wallets. In August, it traded at $0.57.
It later rose, breaking above $1.5 in September and $2 in October.
The bull market run continued into November, reaching a new all-time high of $5.35 on January 6, 2025. Later, it quickly reversed, falling below $3.50 in February and $2.00 in April.
It began recovering in May, rising above $3.50. In July, it fell below $3.0, and, like Solana and Ethereum Layer 2 networks, broader adoption still depends on ecosystem depth, since those rivals already benefit from deep liquidity.
It rose to $3.60 by October, then entered a bear run. Decentralized exchanges, lending platforms, and liquid staking can strengthen ecosystem liquidity, while ecosystem partners can support token distribution and liquidity management.
By November, it had dropped to $2, and in December to $1.6.
In January 2026, it recovered to $1.9, but erased those gains in February, falling below $1. It reached $0.90 in April. In June, it dropped to $0.70 and maintained that level into July.

