Oil’s Supply Shock Reprices Gold, Gas, Copper, and Grains
Key Takeaways
- •Brent crude rose 6.39% for the week to settle at $94.39 a barrel and WTI gained 5.66% to $87.06, as U.S. sanctions threats against Iran's trading partners and reduced Strait of Hormuz traffic raised supply risk.
- •Spot gold climbed more than 5% for the week to $4,623.94 an ounce, supported by a dollar near three-month lows, softer expectations for Federal Reserve tightening, and a breakout above its 200-day moving average near $4,513.
- •U.S. natural gas futures reached a near four-week high of $2.87 per mmBtu, but record Lower 48 production of 111.5 billion cubic feet per day and storage roughly 6% above the five-year average limited the upside.
- •LME copper eased toward approximately $13,888 a metric ton, its lowest level since early August, as rising on-warrant inventories and uneven Chinese demand prevented confirmation of a broad industrial rebound.
- •The Week 35 outlook anticipates continued volatility led by oil and gold, with the EIA Weekly Petroleum Status Report on August 26 and the Natural Gas Storage Report on August 27 as the first major tests of whether the geopolitical premium has physical support.
Quick Answer
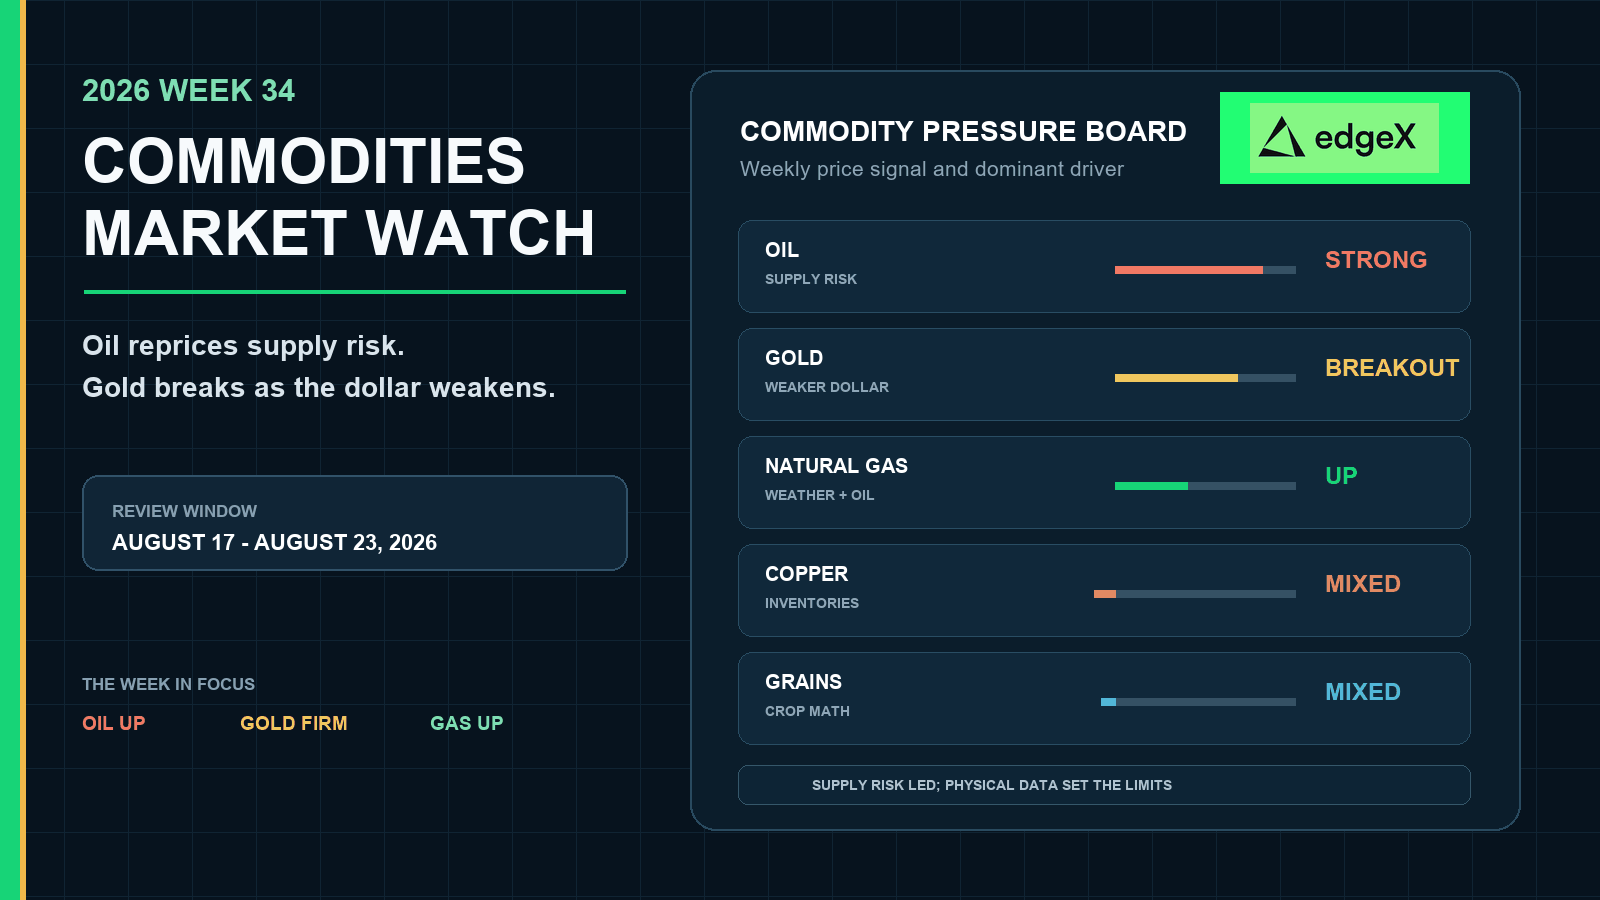
Week 34 was a supply-risk week. Oil surged because sanctions threats and restricted Strait of Hormuz traffic made future supply less certain, not because the global economy suddenly accelerated. Gold also rallied, but through a different channel: a weaker dollar, softer confidence in U.S. policy settings, and technical momentum. U.S. natural gas gained on hotter forecasts and firm oil, yet record production and a storage surplus capped the physical urgency. Copper and grains were more restrained because their near-term fundamentals still depended on Chinese consumption, exchange inventories, crop size, weather, and exports. In Week 35, traders should avoid treating the complex as one directional trade: geopolitical confirmation favors oil, falling real yields favor gold, improving physical demand favors copper, and adverse weather or stronger exports would be needed to tighten grains.
Week 34 Put Supply Security Back at the Center
The review window ran from August 17 through August 23, 2026. The dominant market event was not a broad improvement in demand. It was a repricing of the probability that oil and LNG would become more difficult, expensive, or risky to move through the Middle East.
Reuters reported on August 21 that Brent gained 6.39% for the week and WTI gained 5.66%. President Donald Trump's threat of sanctions on Iran's trading partners raised expectations of tighter supply, while Iran warned of a severe response. Kpler data cited by Reuters showed only seven commodity ships crossed the Strait of Hormuz on Thursday, about half the previous day's count. Before the conflict, the waterway handled roughly one-fifth of global oil and LNG supply.
That transmission channel matters. Fewer vessels do not need to create an immediate production loss to lift prices. Longer voyages, higher insurance, delayed cargoes, precautionary inventory building, and competition for alternative barrels can all increase the delivered cost of energy. The result is an inflationary supply shock that can pressure consumers even while underlying growth remains mixed.
Oil's geopolitical premium spread beyond crude
The energy shock reached freight, refining margins, petrochemicals, airline costs, and inflation expectations. It also changed how markets interpreted other commodities. Gold could rise as a policy hedge, while copper could remain hesitant because expensive energy is not the same as stronger industrial demand.
The distinction explains why Week 34 did not produce a simple risk-on signal. Producers and energy exporters benefited from higher prices, but import-dependent economies and transport-intensive companies faced a more difficult cost environment. Alternative supply through pipelines, U.S. shale, Venezuela, and the United Arab Emirates could soften the shortage, but those channels could not instantly replace normal Hormuz flows.
Energy inflation complicated the growth signal
When oil rises because demand is strong, copper and cyclical assets often confirm the move. When oil rises because supply security deteriorates, the macro effect can be stagflationary: headline inflation rises while real household purchasing power falls. Week 34 looked closer to the second case.
That is why confirmation from copper, freight volumes, refinery utilization, and Chinese physical demand mattered more than oil's price alone. Without that confirmation, the correct reading was not "global growth is booming." It was "the market is paying more for reliable energy supply."
Week 34 Commodities Dashboard
| Market | Week 34 Result | Dominant Driver |
| Brent crude | $94.39 Friday; +6.39% weekly | Iran sanctions risk, constrained Middle East supply, and fewer Hormuz transits |
| WTI crude | $87.06 Friday; +5.66% weekly | Global supply premium and tighter replacement-barrel economics |
| Gold | Spot $4,623.94 Friday; more than +5% weekly | Weaker dollar, Treasury buyback expectations, and technical momentum |
| U.S. natural gas | Near four-week high at $2.87/mmBtu Wednesday | Hotter forecasts and firm energy complex, capped by record production and ample storage |
| Copper | Softer physical confirmation | Rising visible stocks and uneven Chinese demand offset structural scarcity |
| Corn, soybeans, wheat | Crop-led and mixed | USDA August estimates, weather, export demand, and harvest-size expectations |
The table separates price direction from economic meaning. Oil signaled supply insecurity. Gold signaled demand for a currency and policy hedge. Natural gas reflected both weather support and a substantial U.S. supply cushion. Copper and grains required their own physical confirmation.
Oil and Gas Diverged by Physical Market
Brent settled Friday at $94.39 a barrel, up $0.61 or 0.65% on the day. WTI settled at $87.06, up $0.23 or 0.26%. The weekly gains were much larger because the market progressively added a disruption premium as sanctions rhetoric intensified and Middle East flows remained curtailed.
The immediate bullish case rested on logistics as much as production. The Strait of Hormuz connects Gulf exporters with global consumers, and normal traffic supports oil as well as LNG. When transits fall, buyers may bid more aggressively for Atlantic Basin cargoes, raise inventories, or pay for alternative routes. Those actions transmit the shock across benchmarks before official production statistics show the full effect.
Hormuz risk lifted the crude premium
Oil's Week 34 close embedded a larger tail risk: sanctions or retaliation could reduce supply further, while a diplomatic breakthrough could remove part of the premium quickly. That made crude unusually sensitive to headlines and positioning.
The practical test was physical persistence. If tanker traffic remained constrained and nearby spreads stayed firm, the premium would have fundamental support. If traffic normalized and alternative barrels arrived faster than expected, part of the rally could reverse even without a change in long-term demand.
Storage and logistics kept natural gas regional
U.S. natural gas futures rose to a near four-week high on Wednesday, August 19. The September contract gained 3.5% to $2.87 per million British thermal units as hotter forecasts increased expected cooling demand and firm oil supported the wider energy complex.
The supply side was less bullish. LSEG data cited in the report put Lower 48 production at an average 111.5 billion cubic feet per day in August, above July's monthly record of 110.7 bcfd. U.S. LNG feedgas averaged 17.2 bcfd. For the week ended August 14, the EIA later reported working gas of 3,169 Bcf, around 6% above the five-year average. This cushion meant hot weather could lift Henry Hub without creating the same scarcity premium seen in internationally exposed LNG markets.
Europe and Asia faced a different equation. Reuters reported on August 20 that European Union storage was around 62% full and that officials saw no immediate supply emergency. Even so, European TTF and Asian JKM prices remained far above Henry Hub because buyers were more exposed to cargo availability, shipping routes, and replacement costs. Natural gas was therefore one commodity name covering several distinct physical markets.
Gold Broke Higher on Dollar and Policy Risk
Spot gold rose 2.4% on Friday to $4,623.94 an ounce after reaching $4,631.99, its highest level since May 15. U.S. gold futures settled 2.4% higher at $4,680.60. Reuters reported that bullion gained more than 5% during the week and moved above its 200-day moving average near $4,513.
The rally combined macro and technical forces. The dollar fell toward a three-month low as investors considered whether expanded Treasury buybacks would calm bond markets while weakening confidence in the currency. Softer economic data and reduced conviction around further Federal Reserve tightening supported rate-sensitive demand. Once gold cleared major technical levels, options and momentum flows amplified the move.
Gold and oil sent different policy messages
Oil warned that energy inflation could remain elevated. Gold suggested that investors were also hedging currency, bond-market, and growth uncertainty. Both could rise together without confirming the same economic outcome.
This combination is difficult for policymakers. Lower rates can support growth and weaken the dollar, which is often positive for gold. But an energy shock can keep headline inflation high and limit how quickly policy can ease. The gold rally therefore looked durable only if the dollar and real yields continued to cooperate; a sharp rebound in either could challenge the technical breakout.
Copper Still Needed China to Validate the Cycle
Copper did not deliver the same unambiguous message as oil or gold. A Week 34 market brief showed LME copper easing toward roughly $13,888 a metric ton by Thursday, its lowest level since early August, as on-warrant inventories rose. That was a warning against reading the oil rally as proof of synchronized industrial acceleration.
The long-term case remained constructive. Power grids, electric transport, renewable generation, data centers, and AI infrastructure are copper intensive, while mine development is slow. But structural scarcity and current demand are different time horizons. Near-term price strength needs support from falling exchange inventories, higher physical premiums, stronger fabrication demand, and improving Chinese industrial activity.
Visible inventories challenged the bullish narrative
China is the key verification market because it dominates refined-copper consumption. Property weakness can offset strength in grids, equipment, and strategic manufacturing. A weaker dollar may support the quoted price, but it does not create physical orders by itself.
For that reason, copper remained a conditional signal in Week 34. If Chinese premiums strengthened and exchange stocks fell, the market could transition from a scarcity story to a demand-confirmed rally. If inventories continued to build, high prices would risk encouraging substitution, scrap supply, and demand deferral.
Grains Stayed Anchored to Crop Arithmetic
Corn, soybeans, and wheat followed the crop calendar more than the energy shock. The USDA's August World Agricultural Supply and Demand Estimates and Crop Production reports shifted attention toward field-based yield estimates, harvested acreage, global ending stocks, and export competitiveness.
Large production expectations can weigh on futures even as oil raises fertilizer, diesel, drying, and freight costs. Those costs matter for producer margins and the longer-run price floor, but nearby grain direction still depends on whether supply estimates tighten. Late-August weather can change soybean pod fill, corn maturity, and regional yield assumptions, while export sales determine how quickly projected stocks are absorbed.
The right Week 34 interpretation was therefore selective. Energy inflation raised the cost base. It did not automatically create grain scarcity. A stronger grain rally required either adverse weather, lower production estimates, stronger exports, or disruption to competing Black Sea and South American supply.
Cross-Market Impact Map
| Commodity Signal | Economic Transmission | What Would Confirm It |
| Oil above $90 | Higher freight, fuel, inflation expectations, and pressure on importers | Persistently constrained Hormuz traffic and firm nearby spreads |
| Gold above its 200-day average | Weaker dollar, lower real-rate expectations, and policy hedging | Continued dollar weakness, softer real yields, and ETF or futures demand |
| U.S. gas near a four-week high | More cooling demand and energy-complex support | Storage injections below expectations or lower production |
| Copper lagging oil | Supply shock is stronger than global-demand acceleration | Chinese premiums rise while visible inventories fall |
| Grains remain crop-led | Food inflation is not yet following energy one-for-one | Weather damage, lower USDA supply, or stronger exports |
What Week 34 Changed
Week 34 moved the commodity debate from "is demand improving?" to "what is reliable supply worth?" Oil carried the clearest answer, with Brent and WTI posting strong weekly gains as sanctions and shipping risk increased. Gold showed that the same week could also reward a hedge against dollar and policy uncertainty.
Natural gas demonstrated why regional balances matter. Global LNG buyers faced shipping and replacement-cargo exposure, while U.S. Henry Hub still had record production and a storage surplus. Copper refused to confirm a broad growth boom because physical demand and inventories remained mixed. Grains stayed tied to crop balance sheets.
The lasting lesson was that commodity inflation can broaden without a synchronized demand expansion. Traders who separated geopolitical supply, currency, weather, inventory, and end-demand channels received a clearer signal than those who treated every commodity as one macro trade.
Week 35 Outlook: Volatility Needs Physical Confirmation
The Week 35 base case, covering August 24-August 30, is continued volatility with leadership still concentrated in oil and gold. Two dated physical checks arrive quickly: the EIA Weekly Petroleum Status Report is scheduled for Wednesday, August 26, and the EIA Weekly Natural Gas Storage Report for Thursday, August 27. Those releases will test whether the geopolitical premium is being reinforced by U.S. inventory tightness or offset by domestic supply.
The main causal channel is straightforward. Continued disruption or sanctions risk restricts available cargoes, raises insurance and freight costs, and pushes refiners and importers toward alternative barrels. That supports oil, can lift inflation expectations, and may delay rate relief. A diplomatic opening or a normalization of Hormuz traffic would reverse the channel, lowering delivered energy costs and removing some of the risk premium.
Oil and gas need geopolitical and inventory confirmation
Oil remains biased higher while shipping is constrained, but chasing every headline is dangerous after a 6% weekly move. Traders should look for confirmation in tanker traffic, nearby calendar spreads, refinery margins, and the August 26 EIA report. If crude and product stocks tighten together, the rally gains physical credibility. If products build and traffic normalizes, the market becomes more vulnerable to profit-taking.
For U.S. gas, the August 27 storage report is the decision point. A smaller-than-expected injection, persistent heat, or lower production would erode the storage cushion and support Henry Hub. Another comfortable build alongside record output would keep the U.S. benchmark from fully following international LNG prices.
Gold needs dollar and real-yield follow-through
Gold enters Week 35 with strong momentum but also greater sensitivity to a reversal. The breakout remains constructive while the dollar stays weak and real yields do not rise sharply. A close back below the 200-day moving average near $4,513 would weaken the technical case, especially if Treasury yields rebound.
The upside risk is a renewed policy-confidence shock or further geopolitical escalation, which could attract defensive flows. The downside risk is that calmer bond markets and stronger U.S. data lift the dollar. Readers should therefore use dollar direction and real yields as the decision criterion rather than assuming oil strength alone guarantees further gold gains.
Copper and grains must prove their own fundamentals
Copper needs evidence that Chinese and global industrial demand is absorbing available metal. Falling LME and Shanghai inventories, stronger Chinese premiums, and improving factory orders would validate a broader rally. Continued inventory accumulation would argue that the market is still pricing long-term scarcity more aggressively than current consumption.
Grains need a weather or demand catalyst. Crop-condition changes, late-summer heat, export sales, and any Black Sea disruption deserve more weight than crude's headline move. Higher fuel and freight costs can support the cost floor, but without a tighter crop balance they are unlikely to create a durable, synchronized grain rally.
The principal uncertainty is geopolitical: a single diplomatic or military development can change the energy premium faster than weekly data. The reader-facing implication is to require market-specific confirmation. Favor oil only while logistics remain constrained, gold while the dollar and real yields cooperate, copper when physical demand improves, and grains when crop or export balances tighten.
Trade Commodities Perpetuals On-Chain with edgeX
Commodity markets move fast. Your trading infrastructure should too.
edgeX is a decentralized exchange built on EDGE chain, settling on Ethereum via Arbitrum, that lets traders access tokenized RWA commodities perpetuals with institutional-grade execution and true self-custody. No KYC. No centralized custodian. Just full control of your assets, your private keys, and your positions.
Why traders choose edgeX for commodities:
- Ultra-deep liquidity: $10 million of depth within a one-basis-point spread, with sub-0.1-basis-point slippage on trades over $100,000, even during peak volatility.
- High-performance engine: Up to 200,000 orders per second with sub-10 millisecond matching latency.
- True self-custody: Withdrawals require only your wallet authorization; no platform approval needed.
- No KYC required: Start trading commodities, tokenized stocks, and crypto perpetuals without identity verification.
- 100% trading fee rewards: edgeX's Trade to Own program returns 100% of trading fees back to users in $EDGE tokens.
- USDC-backed settlement: USDC is designed by Circle to be redeemable 1:1 for U.S. dollars, giving traders a familiar settlement base.
Whether you're trading gold, oil, or other RWA commodities, edgeX gives you the liquidity depth of a centralized exchange with the security of on-chain settlement.
The platform is available on desktop and as a native mobile app on iOS and Android, so you can manage positions and react to commodity market moves from anywhere.
Ready to trade commodities perpetuals without the constraints of a centralized exchange? Start trading on edgeX with no KYC and no compromises.
Frequently Asked Questions
What dates did 2026 Week 34 cover?
This review covers August 17 through August 23, 2026. The principal futures-market close was Friday, August 21.
Why did oil rise so sharply in Week 34?
Oil rose because sanctions threats against Iran's trading partners, constrained Middle East supply, and reduced Strait of Hormuz traffic increased the probability that future barrels would be harder or more expensive to move. Brent gained 6.39% and WTI gained 5.66% for the week.
Why did gold rise at the same time as oil?
Gold and oil responded to different forces. Oil priced a supply shock. Gold benefited from a weaker dollar, uncertainty around Treasury and bond-market policy, reduced confidence in further rate increases, and a technical break above its 200-day moving average.
Did copper confirm a global growth rebound?
Not yet. Structural demand remained strong, but rising visible inventories and uneven Chinese end demand prevented a decisive confirmation. Falling stocks and stronger Chinese physical premiums would make the bullish signal more credible.
What is the Week 35 commodities outlook?
The base case is high volatility rather than a uniform rally. Oil remains supported while Hormuz traffic and supply are constrained; gold needs continued dollar weakness or softer real yields; U.S. gas needs storage tightening; copper needs China-demand confirmation; and grains need adverse weather or stronger exports. The August 26 petroleum report and August 27 gas storage report are the first major physical tests.

