2026 Week 33 Commodities Market Watch: Oil and Gas Rally as Gold Holds Firm and Growth Signals Diverge
Key Takeaways
- •Brent crude settled at $88.52 a barrel on Friday, August 14, up 1.67%, while U.S. crude finished at $82.40, up 1.42%, as faltering U.S.-Iran talks lifted supply-risk premiums.
- •The United States threatened to increase economic pressure on Iran, possibly extending a naval blockade, heightening concern around the Strait of Hormuz, the chokepoint for roughly a fifth of globally traded oil and LNG.
- •Spot gold rose 0.53% to $4,374.27 an ounce and the dollar index fell 0.28% after an unexpected decline in U.S. retail sales reduced expectations of a near-term Federal Reserve rate increase.
- •Copper sent a mixed growth signal, with structural demand support offset by uneven China and manufacturing data, leaving traders awaiting confirmation from inventories and physical premiums.
- •Grain markets traded on USDA August supply-and-demand estimates, yield prospects, and late-summer weather rather than on the energy rally.
Quick Answer
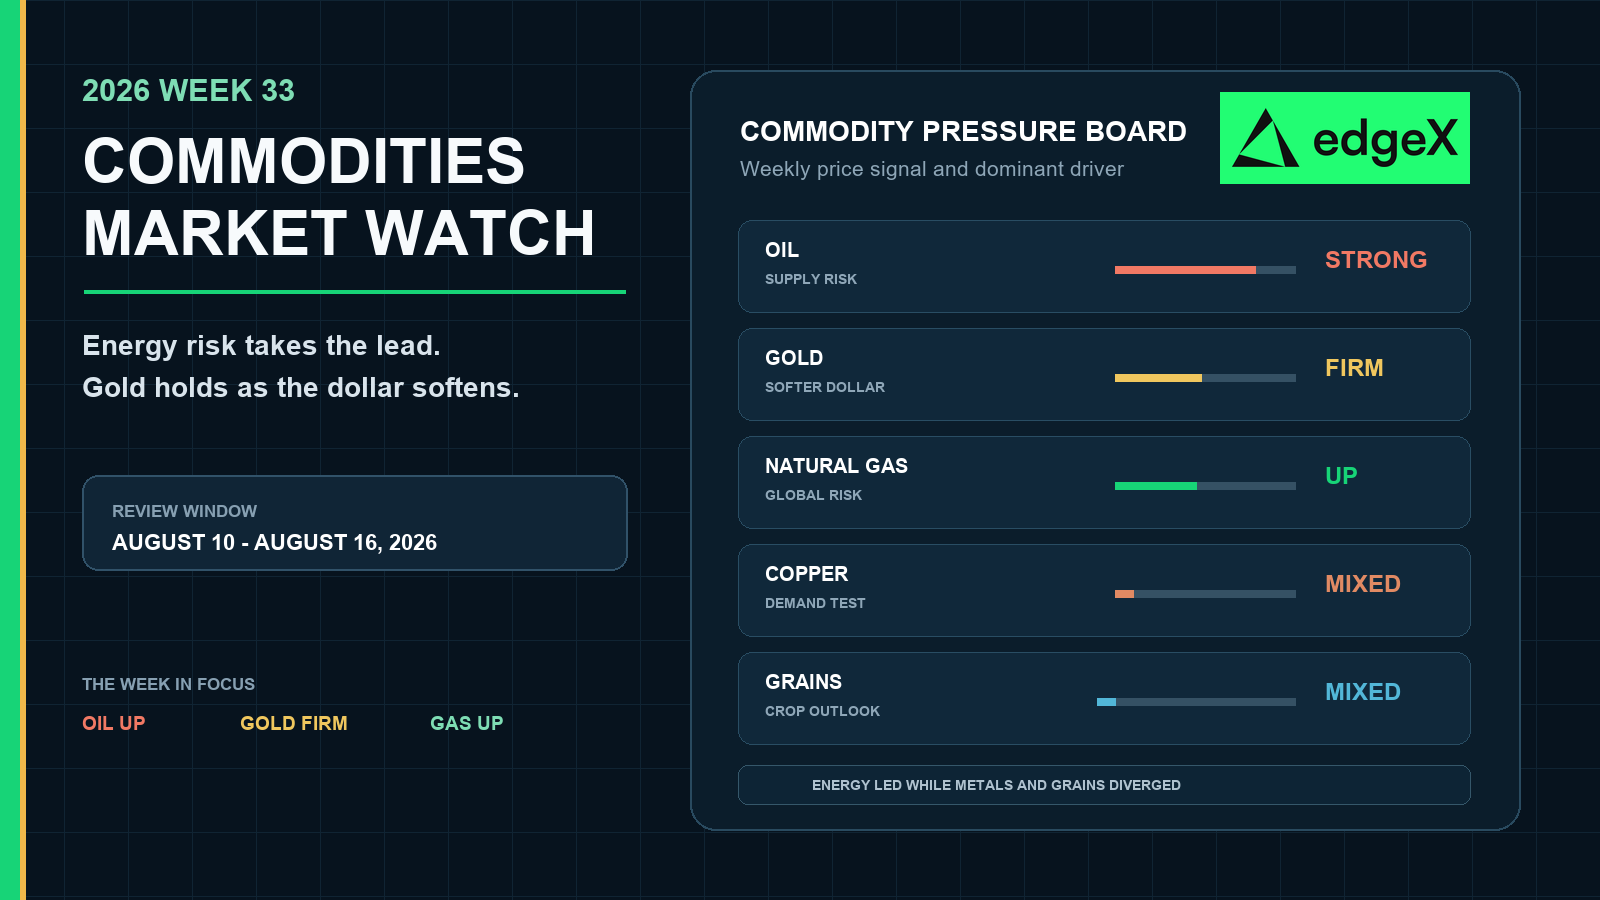
Week 33 was led by energy risk. Oil and gas carried the clearest upside pressure because U.S.-Iran talks faltered and markets confronted the possibility of tighter export flows. Gold also rose, but for a different reason: weaker U.S. consumption data pushed the dollar lower and reduced expectations of another near-term Federal Reserve rate increase. Copper offered a less decisive growth signal because structural demand remained constructive while China and manufacturing data stayed uneven. Agriculture traded its own balance-sheet logic as the USDA's August estimates and late-summer weather refocused attention on crop size, yields, and export demand.
Energy Reclaimed the Macro Narrative
The review window ran from August 10 through August 16, 2026, and the main market close came on Friday, August 14. By the end of the week, commodities were no longer sending the fragmented message seen one week earlier. Energy had become the dominant macro channel, even though metals and agriculture still moved for different reasons.
The catalyst was geopolitical rather than a sudden acceleration in global demand. Reuters reported that faltering efforts to end the Iran conflict left oil and gas positioned for sizeable weekly gains. The United States also threatened to increase economic pressure on Iran, including the possibility of extending a naval blockade. That raised the value of near-term supply security and pushed traders to pay more for disruption risk ahead of the weekend.
The distinction matters. An oil rally caused by stronger consumption can support a broad growth narrative. An oil rally caused by threatened supply can weaken growth by lifting transport, production, and household energy costs. Week 33 was primarily the second type. That is why energy strength arrived alongside softer consumer data and weaker equities on Friday rather than as part of a simple risk-on move.
Inflation risk returned through the supply channel
Energy prices feed quickly into headline inflation, freight, aviation, chemicals, and consumer expectations. The University of Michigan's early-August survey showed U.S. consumer sentiment deteriorating as households reacted to the higher cost of living associated with the Middle East conflict. This connected the commodity shock to the policy debate: higher oil can keep inflation elevated even when underlying demand is losing momentum.
Markets therefore faced an uncomfortable combination. Softer retail sales reduced the case for tighter monetary policy, but higher oil increased the risk that inflation would remain sticky. Gold benefited from the first part of that combination. Consumers, transport-intensive companies, and import-dependent economies had to absorb the second.
Week 33 Commodities Dashboard
| Market | Week 33 Read | Dominant Driver |
|---|---|---|
| Brent and WTI crude | Strong weekly advance | Iran-related supply risk and threatened pressure on export flows |
| Gold | Firm; spot near $4,374 Friday | Weaker dollar and reduced expectations of a near-term Fed hike |
| Natural gas | Weekly gains with regional divergence | Geopolitical risk, LNG exposure, storage, weather, and infrastructure |
| Copper | Mixed macro signal | Structural scarcity versus uneven China and manufacturing demand |
| Grains | Balance-sheet and weather market | USDA August estimates, yield expectations, crop condition, and exports |
| U.S. dollar | Weaker Friday | Surprise decline in U.S. retail sales supported dollar-priced commodities |
The dashboard separates the week's price moves from their causes. Energy strength warned about supply and inflation. Gold strength pointed toward softer policy expectations and defensive demand. Copper did not confirm a synchronized industrial rebound, while grains remained tied to harvest arithmetic.
Oil Priced a Larger Disruption Tail
Brent crude settled Friday at $88.52 a barrel, up 1.67% on the session. U.S. crude finished at $82.40, up 1.42%. More important than the one-day move was the weekly context: both oil and gas were poised for substantial gains as negotiations failed to produce a clear route away from conflict.
The oil market had to price two related risks. The first was the physical loss of Iranian supply or restrictions on its movement. The second was the broader possibility that shipping, insurance, tanker availability, and regional exports could become more difficult even without a complete shutdown. A naval blockade can affect the price of moving barrels before it changes the measured volume of production.
Physical data still mattered
Geopolitics can dominate price action, but weekly U.S. petroleum data remained essential for testing whether the risk premium was being reinforced by domestic tightness. The EIA's Weekly Petroleum Status Report provided the market's read on crude stocks, refinery utilization, gasoline, distillates, imports, and implied demand.
Those components should be read together. A crude draw is more bullish when gasoline and distillate inventories also tighten and refinery runs reflect healthy end demand. A crude draw is less decisive when products build or when exports and timing explain much of the move. In Week 33, however, inventory nuance had less influence on the closing narrative than Iran-related risk. Traders were paying for the possibility that future barrels would become harder or more expensive to move.
The result was a classic supply-risk rally: supportive for producers, potentially damaging for consumers, and inflationary if it persisted. It also increased the sensitivity of every new diplomatic headline. A credible de-escalation could remove part of the premium quickly, while a further restriction on flows could extend it.
Natural Gas Rose, but It Was Not One Global Market
Reuters grouped oil and gas together as markets positioned for sizeable weekly gains, but natural gas still required a regional reading. U.S. Henry Hub, European gas, and Asian LNG do not share identical storage, weather, pipeline, or shipping constraints. A geopolitical shock can lift the entire complex while producing very different magnitudes across benchmarks.
For the United States, the EIA storage report remained the key physical anchor. Storage relative to the five-year range determined how much urgency traders attached to summer heat, power burn, LNG feedgas demand, and hurricane risk. A comfortable inventory cushion can restrain Henry Hub even while global LNG prices rise. A tightening storage path can make the same weather forecast far more powerful.
European and Asian buyers were more exposed to shipping and replacement-cargo risk. If geopolitical stress affects oil exports, tanker routes, or LNG logistics, buyers may compete more aggressively for flexible cargoes. That channel explains why a global gas risk premium does not automatically translate into the same percentage move in U.S. futures.
Gold Benefited from Softer U.S. Data
Gold's Friday move came from the macro side of the commodity complex. Spot gold rose 0.53% to $4,374.27 an ounce, while U.S. gold futures settled 0.4% higher at $4,437.30. The dollar index fell 0.28% after U.S. retail sales unexpectedly declined, reducing expectations that the Federal Reserve would raise rates at its next meeting.
That combination is usually constructive for gold. A weaker dollar makes dollar-priced bullion less expensive for many non-U.S. buyers, while lower expected policy rates reduce the opportunity cost of holding an asset that pays no interest. Geopolitical uncertainty added a defensive layer, but the immediate Friday catalyst was the interaction between consumption data, the dollar, and policy expectations.
Gold and oil sent different policy messages
Gold and oil both rose, yet they were not confirming the same scenario. Gold reflected concern that demand and consumer momentum were softening. Oil reflected concern that supply could become less secure. Together, they raised the possibility of slower growth with persistent headline inflation.
That mix is important for currencies, bonds, equities, and crypto. If central banks focus on weaker activity, liquidity expectations can become more supportive. If they focus on energy-driven inflation, rate relief may be delayed. Week 33 did not resolve that tension; it made the tension more visible.
Copper Needed Better Demand Confirmation
Copper remained the best test of whether the commodity rally represented global expansion or mainly a supply shock. Long-term fundamentals continued to support the metal: grid investment, electrification, renewable integration, data centers, and AI infrastructure all require large amounts of copper, while new mine supply is difficult and slow to develop.
Near-term signals were less convincing. China remained central because it dominates refined-copper consumption and industrial-metals sentiment. Traders had to weigh infrastructure and strategic investment against uneven property, manufacturing, and household demand. A softer dollar could help metal prices, but currency support alone could not prove that physical consumption was accelerating.
The correct Week 33 interpretation was therefore conditional. Firm copper alongside stronger physical premiums, lower exchange inventories, and improving China demand would validate a broader growth signal. Copper resilience without those confirmations would remain primarily a scarcity story. That difference matters when investors use copper as a proxy for the global cycle.
Grains Returned to Crop Size and Weather
Agricultural markets followed a different calendar. The USDA's August World Agricultural Supply and Demand Estimates and Crop Production reports updated the market's view of U.S. corn, soybean, and wheat supply. By mid-August, traders were increasingly focused on yield potential, harvested acreage, late-season weather, global ending stocks, and export competitiveness.
Large production expectations can pressure grain prices even when energy rises. Conversely, hot or dry weather during critical development stages can tighten projected balances quickly. The August reports matter because they move the conversation from early planting assumptions toward field-based crop estimates and more realistic harvest expectations.
Energy still affected agriculture through fertilizer, fuel, freight, and biofuel economics, but those links did not replace crop fundamentals. Grain traders needed to distinguish an immediate production signal from a longer-term cost signal. Week 33's oil rally raised operating and transport risk; USDA estimates and weather determined whether corn and soybean supplies could absorb it.
Cross-Market Impact Map
| Commodity Signal | Constructive Interpretation | Main Risk |
|---|---|---|
| Oil and gas rally | Higher cash flow for producers and energy exporters | Inflation, weaker consumption, and geopolitical escalation |
| Gold strength | Softer dollar and lower rate expectations support liquidity-sensitive assets | Defensive demand may signal slower growth |
| Copper resilience | Grid, AI, and electrification demand remain durable | China demand may fail to confirm the price signal |
| Large grain supply | Food-cost pressure can ease | Weather or export disruption can reverse the balance quickly |
What Week 33 Changed
Week 33 moved energy back to the center of the macro discussion. The market could no longer treat Iran-related risk as a background issue because the threat of tighter export flows was affecting oil, gas, consumer sentiment, and inflation expectations at the same time.
Gold showed that weaker activity data still mattered. Its advance, alongside a softer dollar, suggested that traders were reducing the probability of another immediate rate increase. Copper was more cautious, requiring physical and China-demand confirmation before it could validate a stronger global cycle. Grains remained governed by crop size and weather.
The week's lasting lesson was that commodity inflation can return without a synchronized demand boom. Oil and gas can rise because supply security deteriorates. Gold can rise because growth expectations weaken. Copper can remain supported by scarcity even when current demand is mixed. Agriculture can soften on a large crop while energy costs rise. Reading those channels separately produced a clearer macro picture than treating the entire complex as one trade.
Trade Commodities Perpetuals On-Chain with edgeX
Commodity markets move fast. Your trading infrastructure should too.
edgeX is a decentralized exchange built on EDGE chain, settling on Ethereum via Arbitrum, that lets traders access tokenized RWA commodities perpetuals with institutional-grade execution and true self-custody. No KYC. No centralized custodian. Just full control of your assets, your private keys, and your positions.
Why traders choose edgeX for commodities:
- Ultra-deep liquidity: $10 million of depth within a one-basis-point spread, with sub-0.1-basis-point slippage on trades over $100,000, even during peak volatility.
- High-performance engine: Up to 200,000 orders per second with sub-10 millisecond matching latency.
- True self-custody: Withdrawals require only your wallet authorization; no platform approval needed.
- No KYC required: Start trading commodities, tokenized stocks, and crypto perpetuals without identity verification.
- 100% trading fee rewards: edgeX's Trade to Own program returns 100% of trading fees back to users in $EDGE tokens.
- USDC-backed settlement: USDC is designed by Circle to be redeemable 1:1 for U.S. dollars, giving traders a familiar settlement base.
Whether you're trading gold, oil, or other RWA commodities, edgeX gives you the liquidity depth of a centralized exchange with the security of on-chain settlement.
The platform is available on desktop and as a native mobile app on iOS and Android, so you can manage positions and react to commodity market moves from anywhere.
Ready to trade commodities perpetuals without the constraints of a centralized exchange? Start trading on edgeX with no KYC and no compromises.
Frequently Asked Questions
What dates did 2026 Week 33 cover?
This review covers August 10 through August 16, 2026. The principal futures-market close is Friday, August 14.
What was the main commodities story in Week 33?
Energy led the week. Oil and gas rose as faltering U.S.-Iran talks and the threat of broader pressure on Iranian export flows increased the market's geopolitical risk premium.
Why did gold rise even as oil increased inflation risk?
Gold responded to a weaker dollar and disappointing U.S. retail-sales data, which reduced expectations of a near-term Federal Reserve rate increase. Oil rose mainly because of supply risk, so the two markets reflected different forces.
Did copper confirm a global growth rebound?
Not decisively. Copper retained support from structural demand and supply constraints, but uneven China and manufacturing signals meant that traders still needed confirmation from physical premiums, inventories, and end demand.
Why were grains different from energy?
Corn, soybeans, and wheat were focused on the USDA's August supply-and-demand estimates, crop yields, weather, and export demand. Higher energy costs mattered, but harvest-size expectations remained the dominant near-term driver.

