2026 Week 31 Commodities Market Watch: Oil Reverses, Copper Defies China Slowdown, and Gas Slips
Key Takeaways
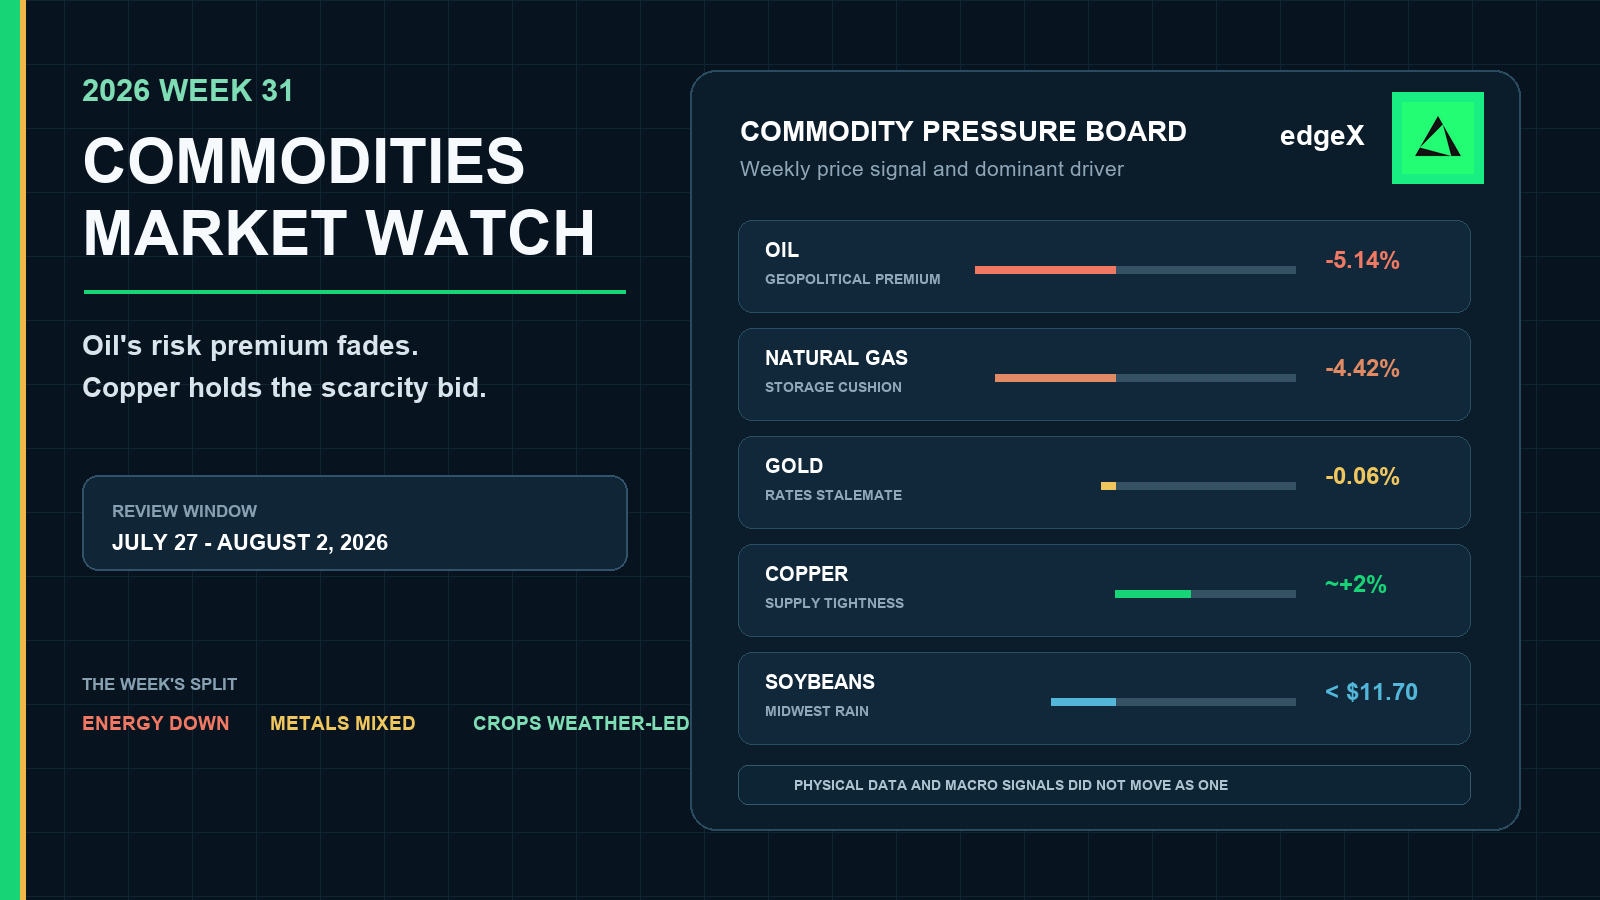
- •Oil declined 5.14% during Week 31 as reduced U.S.-Iran escalation risk lowered the geopolitical premium, despite U.S. commercial crude inventories falling by 7.2 million barrels to 404.5 million barrels.
- •Seven OPEC+ countries announced a 188,000-barrel-per-day production adjustment for September, introducing a supply-side factor just as disruption fears were receding.
- •Copper rose approximately 2% to above $6.45 per pound on tightening concentrate and scrap availability, even as China's official manufacturing PMI dropped to 49.2 from 50.3 in June.
- •Natural gas fell 4.42% as working gas storage reached 3,084 Bcf, sitting 6.4% above the five-year average and easing summer scarcity concerns.
- •Soybean futures dropped below $11.70 per bushel to a four-week low after forecasts predicted beneficial rain across the U.S. Midwest during the yield-sensitive pod-setting stage.
Week 31 Repriced the Source of Commodity Risk
Commodities entered Week 31 carrying the residue of an oil shock. Brent had briefly traded above $100 during the prior week as conflict and shipping risk forced traders to pay for disruption insurance. By July 31, that premium was being handed back. LPL Research's weekly table showed oil down 5.14%, reversing a meaningful part of the previous surge, while the broader commodity complex weakened.
The reversal did not mean the market had discovered abundant supply. It meant the probability assigned to an immediate disruption had fallen. LPL linked crude's decline to a pause in U.S.-Iran strikes and renewed negotiation prospects, even as reports that Iran had blocked tankers in the Strait of Hormuz kept losses from becoming a complete collapse in risk pricing.
That distinction matters. A commodity can fall because demand is weakening, because supply is growing, or because traders no longer need as much insurance against an extreme event. Week 31 oil mostly belonged to the third category. Copper's gain and stable precious metals made it difficult to call the whole week a global-demand retreat.
Friday’s close and Sunday’s decision answer different questions
The weekly performance figures end on July 31. The August 2 OPEC+ meeting belongs to the review window as a news event, but it arrived after the main futures week had closed. Seven participating countries said they would implement a 188,000-barrel-per-day production adjustment in September while maintaining compensation commitments for earlier overproduction.
That announcement shapes the next opening rather than rewriting the prior week's return. It adds a supply-side headwind just as geopolitical premium is fading. Traders therefore entered August with two bearish pressures on crude price formation: less immediate disruption fear and a modest increase in expected supply. Whether physical inventory draws can counter those pressures is the next test.
Week 31 Commodities Dashboard
| Market | Week 31 Signal | What Drove the Read |
|---|---|---|
| Oil | -5.14% through July 31 | Easing U.S.-Iran escalation risk outweighed lingering Strait of Hormuz concerns. |
| Natural gas | -4.42% | Storage reached 3,084 Bcf, 6.4% above the five-year average. |
| Gold | -0.06% | A weaker dollar helped, but higher long-term yields and policy uncertainty restrained demand. |
| Silver | -0.43% | The metal lacked enough monetary or industrial momentum to break from gold's range. |
| Copper | About +2% | Tight concentrate and scrap supply outweighed China's weaker official factory signal. |
| Soybeans | Fell below $11.70/bushel | Forecast Midwest rain improved moisture prospects during a sensitive crop stage. |
| U.S. crude stocks | -7.2 million barrels | Commercial inventories fell to 404.5 million barrels in the week ended July 24. |
The dashboard shows why a broad commodity index can conceal more than it reveals. Energy was weak, precious metals were directionless, copper rose, and soybeans traded weather. Each move came from a different balance between macro expectations and physical fundamentals.
Oil Fell Even as U.S. Crude Stocks Drew Sharply
The EIA's July 29 petroleum report complicated the bearish oil tape. Commercial crude inventories excluding the Strategic Petroleum Reserve fell from 411.7 million to 404.5 million barrels, a weekly draw of 7.2 million barrels. U.S. crude exports rose to 3.47 million barrels per day, refinery inputs increased to 17.34 million barrels per day, and total products supplied rose to 20.75 million barrels per day.
Those are not loose-market numbers. Gasoline stocks were essentially unchanged at 211.3 million barrels, while distillate inventories increased by about 1.1 million barrels. The draw therefore offered evidence that the U.S. physical system was absorbing crude even while futures prices were shedding geopolitical premium.
The draw was evidence, not a floor
Inventory data do not mechanically set price direction. A large draw can be overwhelmed when the market is repricing a low-probability, high-impact disruption. That is what happened in Week 31: the immediate fear of lost barrels faded faster than the inventory report could support prices.
The tension leaves crude vulnerable in both directions. If diplomacy holds and the OPEC+ adjustment reaches the market, another inventory draw may produce only a limited rebound. If shipping risk returns while stocks remain leaner, traders may rebuild the premium quickly. The useful signal is the gap between futures sentiment and physical data, not either input in isolation.
Natural Gas Had Its Own Bearish Logic
Natural gas fell 4.42%, but it should not be treated as a copy of the crude move. The EIA reported 3,084 billion cubic feet of working gas in storage as of July 24, up 28 Bcf from the prior week. Stocks were 32 Bcf below the year-earlier level but 185 Bcf, or 6.4%, above the five-year average.
That cushion reduced the urgency to pay for summer scarcity. Regional details were mixed: the East and Midwest each added 23 Bcf, while the Pacific and South Central regions posted withdrawals. Nationally, however, storage remained within the five-year range and comfortably above the average line.
For traders, gas weakness confirmed that Week 31 energy was not one synchronized position. Crude lost geopolitical insurance. Natural gas reflected storage, weather, power demand, and regional balances. Both fell, but the reasons were different, and that difference matters when the next catalyst arrives.
Gold and Silver Waited for a Clearer Rates Signal
Gold’s 0.06% decline and silver’s 0.43% loss were small enough to describe the week as consolidation. LPL reported that gold remained inside a roughly month-long range while inflation concern and tighter-policy risk offset one another. The dollar weakened, which would normally help dollar-priced metals, but long-term Treasury yields rose after the Federal Reserve held rates at 3.50%-3.75% with three dissents favoring a hike.
Gold therefore received no clean macro instruction. A weaker dollar supported it, but higher real-rate anxiety raised the opportunity cost of holding a non-yielding asset. Silver lacked a strong enough industrial signal to turn copper’s advance into a broader metals breakout.
This restraint is informative. If investors had treated the Fed decision or Middle East risk as an acute safety event, gold should have shown more urgency. If they had treated copper strength as proof of a synchronized manufacturing recovery, silver should have participated more forcefully. Instead, both metals waited.
Copper Rose Through a Conflicted China Signal
Copper was the week’s clearest countertrend market. Trading Economics reported futures above $6.45 per pound on July 31 and on track for a roughly 2% weekly gain. Tightening availability of concentrate and scrap in China supported treatment charges and market spreads, allowing supply constraints to outweigh a less comfortable demand signal.
China's official manufacturing PMI fell to 49.2 in July from 50.3 in June, moving back below the 50 line that separates expansion from contraction. New orders fell to 48.5. For a metal used across power networks, construction, electronics, and industrial equipment, that result should have been a warning.
Supply tightness beat the survey, but confirmation is still needed
Copper’s ability to rise through a weak official PMI suggests the market was trading scarcity rather than a clean China growth acceleration. That is bullish in the short run but less reassuring as a global macro signal. A supply-driven rally can persist, yet it does not automatically validate stronger end demand.
The August 3 private manufacturing survey, released after the review week, added nuance rather than closure. It remained above 50 at 50.9 but slowed from 51.7. Traders now need physical confirmation from imports, inventories, premiums, power-grid spending, and factory orders before treating copper as proof that China's demand cycle has turned higher.
Soybeans Put Weather Back at the Center
Soybeans supplied the week's most relevant agricultural signal. Futures fell below $11.70 per bushel on July 30, reaching a four-week low as forecasts called for useful rain across the U.S. Midwest during pod setting, a stage when moisture can materially influence yield potential.
The move came despite less-than-perfect crop conditions. The good-to-excellent rating had fallen to 63% from 66%, while export demand offered some support. Prices nevertheless favored the forward weather outlook and expectations of ample global supply. That is a reminder that agricultural markets often trade the next rain system more aggressively than the latest macro headline.
Soybeans also carried a China link that copper did not. China is the largest importer, so weaker Chinese demand expectations can reinforce pressure from favorable U.S. weather. In Week 31, however, crop prospects were the clearer immediate catalyst.
Cross-Commodity Market Impact Map
| Driver | Constructive Interpretation | Defensive Interpretation |
|---|---|---|
| Oil risk premium | Lower crude eases inflation and transport-cost pressure | A renewed shipping shock can rebuild the premium quickly |
| U.S. crude draw | Physical demand and exports absorb available barrels | Weekend OPEC+ supply may dilute the draw's price impact |
| Gas storage | Adequate inventories reduce shortage risk | Extreme heat can tighten regional balances despite the cushion |
| Precious metals | A weaker dollar can support a breakout if yields ease | Higher real yields keep gold and silver range-bound |
| Copper | Supply tightness supports price despite soft surveys | Weak China orders eventually challenge a scarcity-led rally |
| Soybeans | Crop stress or export demand can reverse weather pressure | Timely rain and ample global supply keep rallies capped |
What Traders Should Watch Next
Crude now has to reconcile three inputs: the August 2 OPEC+ adjustment, the next EIA inventory report, and the durability of U.S.-Iran diplomacy. If supply rises while disruption risk stays low, oil may struggle to recover. If inventories keep drawing and shipping risk returns, the market can rebuild insurance faster than the modest production increase arrives.
Copper needs demand confirmation from China. The official PMI contraction and the slower private survey do not invalidate the supply story, but they limit how confidently traders can call the rally a growth signal. Gold and silver need the rates market to choose a direction. Natural gas needs weather and storage to tighten together before the national cushion becomes less comfortable.
Week 31’s lesson is that commodities did not move as a single inflation trade. Oil repriced geopolitics, gas priced storage, precious metals priced monetary ambiguity, copper priced scarcity, and soybeans priced rain. The strongest decisions in the next week will come from preserving those distinctions.
Trade Commodities Perpetuals On-Chain with edgeX
Commodity markets move fast. Your trading infrastructure should too.
edgeX is a decentralized exchange built on EDGE chain, settling on Ethereum via Arbitrum, that lets traders access tokenized RWA commodities perpetuals with institutional-grade execution and true self-custody. No KYC. No centralized custodian. Just full control of your assets, your private keys, and your positions.
Why traders choose edgeX for commodities:
- Ultra-deep liquidity: $10 million of depth within a one-basis-point spread, with sub-0.1-basis-point slippage on trades over $100,000, even during peak volatility.
- High-performance engine: Up to 200,000 orders per second with sub-10 millisecond matching latency.
- True self-custody: Withdrawals require only your wallet authorization; no platform approval needed.
- No KYC required: Start trading commodities, tokenized stocks, and crypto perpetuals without identity verification.
- 100% trading fee rewards: edgeX’s Trade to Own program returns 100% of trading fees back to users in $EDGE tokens.
- USDC-backed settlement: USDC is designed by Circle to be redeemable 1:1 for U.S. dollars, giving traders a familiar settlement base.
Whether you’re trading gold, oil, or other RWA commodities, edgeX gives you the liquidity depth of a centralized exchange with the security of on-chain settlement.
The platform is available on desktop and as a native mobile app on iOS and Android, so you can manage positions and react to commodity market moves from anywhere.
Ready to trade commodities perpetuals without the constraints of a centralized exchange? Start trading on edgeX with no KYC and no compromises.
Frequently Asked Questions
What was the biggest commodities story in Week 31 of 2026?
Oil's 5.14% decline was the largest broad-market story. The move reversed part of the prior week's geopolitical surge as U.S.-Iran escalation risk eased, even though U.S. commercial crude inventories fell sharply.
Why did oil fall after a 7.2 million-barrel crude draw?
The inventory draw showed a firmer physical market, but futures were repricing a lower probability of immediate supply disruption. Changes in geopolitical insurance can overwhelm a weekly inventory signal.
Why did copper rise despite weak China manufacturing data?
Copper gained about 2% as shortages of concentrate and scrap tightened supply conditions. China's official PMI contraction limited the demand message, making the rally more about scarcity than broad growth confidence.
What kept gold almost unchanged?
A weaker dollar offered support, while higher long-term yields and tighter-policy concern created resistance. Those opposing forces left gold inside its recent range.
Why were soybeans relevant to Week 31?
Soybeans fell to a four-week low as forecasts of timely Midwest rain improved the yield outlook during pod setting. The move showed how weather and crop conditions can dominate agricultural pricing even in a macro-heavy week.

