2026 Week 29 Commodities Market Watch: Oil Risk, Gold Weakness, Copper Signals, and Inflation Pressure
Key Takeaways
- •Both WTI and Brent crude oil rallied approximately 16% during Week 29, closing at $82.49 and $88.10 respectively, driven by renewed U.S.–Iran hostilities and shipping route disruption concerns rather than inventory draws.
- •EIA data for the week ending July 17 showed crude inventories rising by 2.0 million barrels, gasoline by 0.8 million, and distillates by 1.4 million, yet all categories remained below their five-year averages.
- •COMEX gold declined 2.23% to $4,012.70 and silver fell 6.31% to $56.038, as higher real yields and dollar strength offset the geopolitical safe-haven appeal that typically supports precious metals.
- •Copper served as a key growth confirmation indicator, with its lack of a decisive rally suggesting the oil-led commodity strength was supply-driven rather than demand-driven.
- •The CFTC Commitments of Traders report dated July 17 provided traders a critical positioning checkpoint to assess whether price moves reflected fresh conviction or short covering following the sharp oil rally.
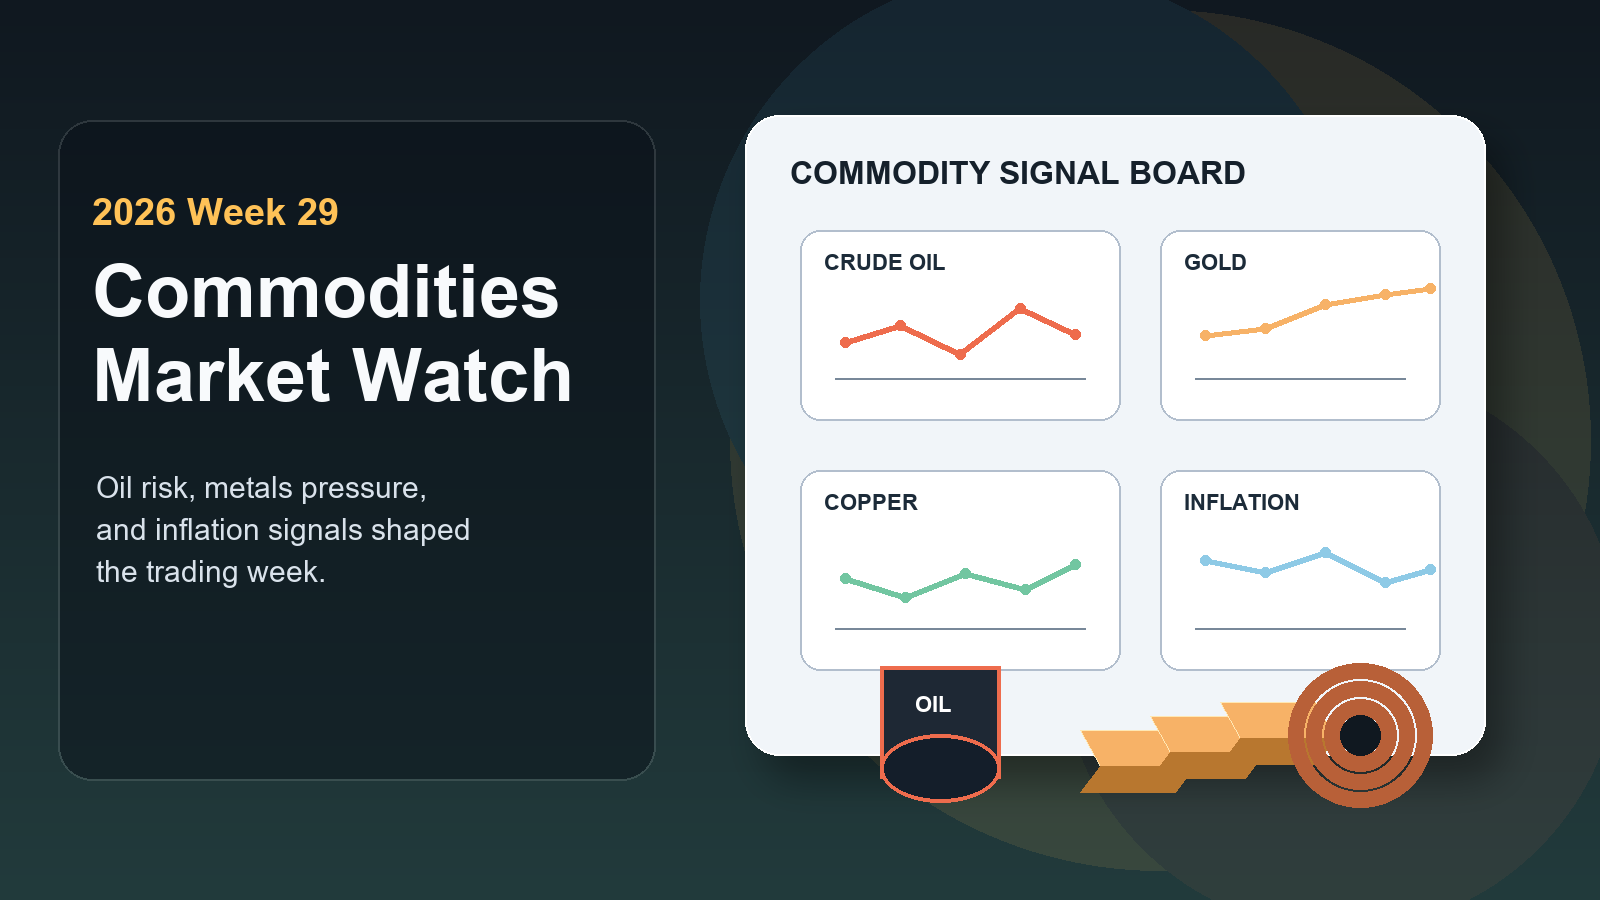
Why Week 29 Matters for Commodities
Commodity markets rarely move in sync as one tidy sector. Week 29 was a good reminder. Oil traded like a geopolitical risk asset. Gold and silver traded like interest-rate-sensitive financial assets. Copper traded like a growth gauge. The result was not a single commodity message, but a dashboard of competing signals.
That is exactly what makes this week useful for traders. If crude oil rises because supply risk is being repriced, that move can support energy producers and inflation-hedge assets while hitting consumers, transportation margins, and rate-sensitive assets. If gold falls in the same week, the market is telling investors that geopolitical fear alone is not enough. If copper fails to join the risk-asset rally, the demand-side story remains incomplete.
This Week Is About Inflation Risk, Not Just Price Direction
The crude oil move matters because it comes after investors had previously leaned toward a disinflation narrative. Oil does not instantly rewrite the inflation story, but it can change the next question. Traders must no longer just ask whether last month's inflation data cooled; they must also ask whether a new energy shock will keep headline inflation sticky.
This distinction matters as much for crypto, equities, bonds, and FX as it does for commodities. Higher oil prices can support energy-linked assets while pressuring growth valuation multiples, importers, and currencies affected by fuel costs. Week 29 is not just a commodity week. It is a macro week centered on a barrel of crude.
Week 29 Commodities Dashboard
| Market Signal | Week 29 Read |
|---|---|
| WTI Crude | Per Reuters market data, closed Friday at $82.49, up approximately 16% for the week. |
| Brent Crude | Closed Friday at $88.10, also up approximately 16% for the week. |
| EIA Crude Inventories | For the week ending July 17, commercial crude inventories rose by 2.0 million barrels, yet remained 6% below the five-year average. |
| Gasoline Inventories | Increased by 0.8 million barrels, while still 7% below the five-year average. |
| Distillate Inventories | Increased by 1.4 million barrels, while still 10% below the five-year average. |
| COMEX Gold | Fell 2.23% this week to $4,012.70. |
| COMEX Silver | Fell 6.31% this week to $56.038. |
| Copper | Remained a cross-verification indicator for industrial demand, not a headline driver. |
| CFTC Positioning | The July 17 COT report served as a critical positioning checkpoint after the oil price rebound. |
This dashboard shows why this week should not be reduced to "commodities are up." Energy surged. Precious metals fell. Industrial metals moved unevenly enough to make demand confirmation matter. That divergence is exactly why weekly commodity analysis needs to separate supply shocks from broad-based commodity demand.
Oil Dominated the Macro Discussion
Oil was the loudest signal this week because the price action was tied to geopolitics, not just inventory accounting. Reuters reported that after renewed U.S.–Iran hostilities and threats to key shipping routes heightened supply disruption concerns, Brent closed at $88.10 on July 17 and WTI at $82.49. Both benchmarks rose approximately 16% for the week, a magnitude sufficient to change how traders interpret inflation, consumer pressure, and central bank risk.
Crucially, oil did not need a perfectly bullish inventory report to rise. In calm markets, traders might focus more on refinery inputs, gasoline inventory draws, distillate inventory builds, or inventory levels relative to seasonal norms. In Week 29, geopolitical risk made the market willing to pay higher prices for optionality. Crude prices became, in part, a price of uncertainty.
Inventories Matter Because Supply Risk Is Already Priced
The EIA data released on July 22 still matters. For the week ending July 17, commercial crude inventories rose by 2.0 million barrels, gasoline inventories by 0.8 million barrels, and distillate inventories by 1.4 million barrels. This combination did not confirm a pure physical shortage narrative. It suggested that the crude rebound was driven less by definitive inventory draws and more by geopolitical risk, shipping anxiety, and the market's willingness to pay for protection against disruption.
For traders, the useful question is not whether every EIA line item confirms the rally. It is whether the inventory builds are large enough to challenge the supply risk premium and break momentum. The answer is no. The report showed inventories rising, but those inventories remain below five-year averages, and the market remains focused on the risk that shipping disruptions could rapidly tighten supply.
In these kinds of weekly moves, risk management matters more than an elegant narrative. Traders who only look at inventory builds might dismiss the rally too quickly. Traders who only look at geopolitical headlines might overlook the fact that physical inventories have not collapsed. The market cares about both, but oil's price direction shows which signal is dominant.
Gold and Silver Failed the Simple Safe-Haven Test
Gold and silver typically attract safe-haven inflows during periods of geopolitical stress, but Week 29 showed that this relationship is not automatic. According to WSJ market data, COMEX gold closed down 2.23% this week at $4,012.70, and silver fell 6.31% to $56.038. Even as the oil market was pricing in greater geopolitical danger, metals looked weak.
This does not mean the safe-haven logic has disappeared. It means the safe-haven logic encountered competition. Higher oil prices can bring inflationary pressure, and inflationary oil prices can make traders less convinced that central banks will ease policy quickly. If yields and the dollar remain firm, gold can come under pressure even when the geopolitical backdrop appears supportive. Silver adds an additional layer of industrial demand complexity, so it can fall further when growth expectations and risk appetite weaken.
Safe-Haven Demand Alone Is Not Enough
For readers who view gold as a single-factor trade, this is an important lesson. Gold can respond to fear, but it also responds to real yields, dollar liquidity, central bank expectations, and positioning. In Week 29, the market appeared more focused on the cost of holding a non-yielding metal than on the protective narrative.
Silver's larger weekly decline adds another cautionary signal. When silver underperforms gold, traders typically read it as pressure on the industrial demand side of the precious metals complex. This does not automatically mean recession fears are rising, but it does mean the market is not rewarding cyclical metal exposure the way it is rewarding oil scarcity risk.
Copper Kept the Growth Signal Complicated
Copper did not dominate this week's price action, but it remains one of the most important confirmation indicators. Oil can rise because supply is threatened. Gold can fall because rates and the dollar are firm. Copper poses a different question: is the real economy strong enough to absorb higher input costs?
This question is especially relevant because global investors are also tracking Chinese demand, manufacturing momentum, construction activity, and grid investment. A strong copper market would make the commodity story look broader. A weak or sideways copper market makes this week look more like an energy shock layered on top of uneven growth.
Chinese Demand Remains the Swing Factor
For copper, China still matters because it sits at the center of construction, manufacturing, grid investment, electric vehicles, and industrial restocking. When Chinese demand looks solid, copper can confirm a global growth trade. When the signals are less convincing, copper becomes a warning: oil-led inflation may be supply-driven rather than demand-driven.
This distinction matters for portfolio interpretation. Demand-driven commodity strength can support cyclicals and emerging markets. Supply-driven oil strength can squeeze margins and consumer spending. Week 29 is closer to the second version, which is why copper is worth watching even when it is not the headline.
The Dollar, Yields, and Positioning Shaped the Action
Commodity traders must also watch financial conditions. A stronger dollar makes dollar-denominated commodities more expensive for non-U.S. buyers, creating headwinds. Higher yields raise the opportunity cost of holding non-income-producing assets, pressuring gold. Positioning can amplify both moves.
This is why the CFTC Commitments of Traders report dated July 17 matters. The CFTC schedule shows the report date falls within Week 29, with the usual Friday release and data from the preceding Tuesday. For a week in which crude oil surged and precious metals weakened, positioning matters because it helps traders judge whether price moves are being reinforced by fresh conviction or driven by short covering and passive adjustments.
The oil market looked especially susceptible to positioning effects. When a market is short or under-hedged before a geopolitical shock hits, the first phase of the move can be very sharp. This does not mean the move is false, but it does mean traders need to distinguish the initial repricing from a sustainable trend.
Cross-Commodity Impact Map
| Driver | Commodity Impact | What Traders Watch |
|---|---|---|
| Middle East Escalation | Supports crude and refined product risk premiums. | Brent, WTI, shipping routes, fuel prices, energy stocks. |
| EIA Inventory Mix | Adds nuance rather than a clearly bullish or bearish signal. | Crude inventory draws, gasoline draws, distillate builds, refinery inputs. |
| Dollar and Yields | Pressure precious metals despite geopolitical stress. | Real yields, DXY, Fed expectations, gold technical levels. |
| Chinese Demand | Prevents copper from being a simple inflation hedge. | Manufacturing data, property signals, grid spending, import demand. |
| CFTC Positioning | Helps identify whether moves are conviction-driven or positioning-driven. | Managed fund exposure, commercial hedging, crowded shorts. |
| Inflation Risk | Reconnects commodities to equities, bonds, FX, and crypto. | Energy pass-through, central bank tolerance, consumer squeeze. |
This map points to the correct trading perspective for Week 29: confirmation. Oil has momentum, but traders still need to test whether inventory data, positioning, and shipping developments support the move. Gold and silver weakened, but traders need to determine whether that weakness is technical unwinding or a deeper rejection of the safe-haven trade. Copper remains the growth checkpoint.
Trade Commodity Perpetuals On-Chain via edgeX
Commodity markets move fast. Your trading infrastructure should too.
edgeX is a decentralized exchange built on the EDGE chain, settling on Ethereum through Arbitrum, giving traders access to tokenized RWA commodity perpetuals with institutional-grade execution and true self-custody. No KYC required. No centralized custodian. Just full control over your assets, private keys, and positions.
Why traders choose edgeX for commodity trading:
- Ultra-deep liquidity: $10 million in depth within a single basis point spread, with slippage under 0.1 basis points for trades exceeding $100,000 even during peak volatility.
- High-performance engine: Up to 200,000 orders per second with matching latency under 10 milliseconds.
- True self-custody: Withdrawals require only your wallet authorization; no platform approval needed.
- No KYC: Start trading commodity, tokenized stock, and crypto perpetuals without identity verification.
- 100% trading fee rewards: edgeX's Trade to Own program returns 100% of trading fees to users in $EDGE tokens.
- USDC-backed settlement: USDC is designed by Circle to be redeemable for U.S. dollars on a 1:1 basis, providing traders with a familiar settlement base.
Whether you trade gold, oil, or other RWA commodities, edgeX offers the liquidity depth of a centralized exchange combined with the security of on-chain settlement.
The platform is available on desktop and via native iOS and Android mobile apps, so you can manage positions and respond to commodity market changes from anywhere.
Ready to trade commodity perpetuals without centralized exchange limitations? Start trading on edgeX, with no KYC and no compromises.
What Traders Should Watch Next
The next test is whether oil can hold its geopolitical premium. If shipping route risks intensify, crude could remain the dominant macro variable even with mixed inventory data. If tensions cool, traders may quickly refocus on refinery utilization, product demand, and whether the recent rally has front-loaded too much fear.
Gold and silver need different triggers. A weaker dollar, lower real yields, or fresh safe-haven buying could stabilize precious metals. Without those factors, metals may remain vulnerable even if geopolitical headlines appear supportive. Copper needs clearer demand signals from China and global manufacturing to translate this week into a broader commodity growth story.
Confirmation Matters More Than a Single Headline
When planning for Week 30, traders should avoid treating one data point as the entire market. Oil needs supply risk confirmation. Gold needs rate confirmation. Copper needs demand confirmation. The dollar and yields need to be watched because they reconnect the commodity narrative to macro liquidity.
That is the practical takeaway from Week 29. Commodities did not deliver one answer. They delivered a set of conditions. The strongest trades for the coming week will likely come from identifying which condition takes the lead first.
FAQ
What was the biggest commodity story in Week 29 of 2026?
Oil was the biggest story. With renewed U.S.–Iran tensions and rising shipping route risks, both WTI and Brent surged, pushing up the supply premium in the crude oil market.
If geopolitical risk rose, why did gold fall?
Gold can benefit from geopolitical pressure, but it also responds to yields, the dollar, central bank expectations, and positioning. In Week 29, these financial market pressures outweighed the safe-haven logic.
What did the latest EIA report show for Week 29?
The EIA report released on July 22, covering the week ending July 17, showed commercial crude inventories rising by 2.0 million barrels, gasoline inventories by 0.8 million barrels, and distillate inventories by 1.4 million barrels. All three categories remained below their five-year averages.
Why does copper matter in commodity market observations?
Copper is a useful industrial demand signal. If copper confirms oil strength, the market may be seeing broader, growth-driven commodity demand. If copper lags, oil strength may be more about supply risk than robust demand.
How should traders use CFTC positioning data?
CFTC positioning helps traders assess whether futures moves are supported by fresh conviction or amplified by crowded trades, short covering, or passive risk reduction.

