United States Drives 93% of Global LNG Growth as Export Dominance Deepens in 2025
Key Takeaways
- •U.S. LNG exports increased from 4.1 trillion cubic feet in 2024 to 5.2 trillion cubic feet in 2025.
- •The United States supplied about 93% of the increase in global LNG exports during 2025.
- •Europe received roughly 68% of total U.S. LNG exports, with shipments averaging a record 10.3 billion cubic feet per day.
- •U.S. natural gas production reached a record 103.9 billion cubic feet per day in 2025, supporting higher exports and domestic consumption.
- •Additional projects including Corpus Christi Stage 3, Plaquemines, Golden Pass, Port Arthur and Rio Grande LNG are expected to expand U.S. export capacity further.
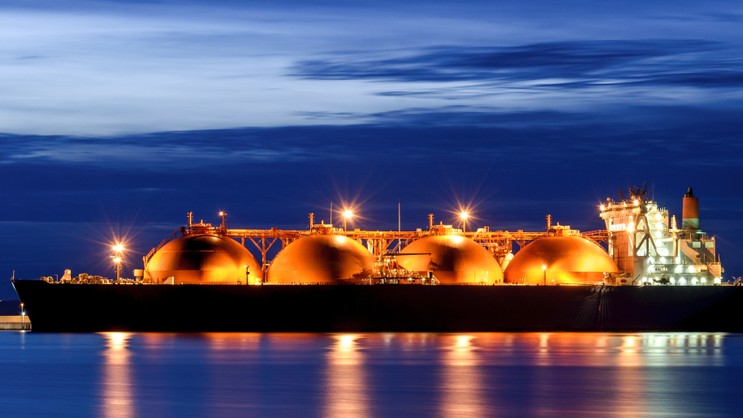
Global liquefied natural gas (LNG) exports expanded by roughly 1.2 trillion cubic feet in 2025, with the United States supplying approximately 1.10 trillion cubic feet of that growth—meaning about 93% of the world's incremental LNG originated from American facilities.
That figure becomes even more striking in historical context. In 2015, the United States exported less than 0.03 trillion cubic feet of LNG. By 2025, exports had surged to 5.2 trillion cubic feet, establishing the country as the world's largest LNG exporter by a wide margin.
According to the Energy Institute's 2026 Statistical Review of World Energy, U.S. LNG exports climbed 27% year-over-year, rising from 4.1 trillion cubic feet in 2024. Total global exports increased from 19.3 trillion cubic feet to 20.4 trillion cubic feet over the same period.
The U.S. share of the global LNG export market stood at 25.4%. Qatar ranked second with 3.9 trillion cubic feet, followed by Australia at 3.7 trillion cubic feet. The concentration of incremental supply matters because new volumes determine which exporters can respond when importers need additional cargoes, not merely which countries already hold large market shares.
How a Decade Reshaped the Market
In 2015, Qatar led global LNG exports at 3.7 trillion cubic feet. Australia was still in a phase of rapid expansion, exporting 1.4 trillion cubic feet. The United States was essentially a non-participant.
A decade later, Qatar's export volumes had risen only modestly. Australia had firmly joined the top tier, but its growth trajectory had flattened. U.S. exports, by contrast, had increased more than two hundredfold.
This expansion originated with the shale revolution, which unlocked vast quantities of relatively low-cost natural gas. Existing Gulf Coast infrastructure—pipelines, storage facilities, ports, petrochemical complexes, and a seasoned energy workforce—provided critical reinforcement.
Notably, some of the earliest U.S. LNG export terminals were converted from facilities originally constructed to import gas. That reversal underscored how profoundly the shale boom had shifted expectations: the country transitioned from bracing for greater import dependence to building a major export industry around surplus domestic production.
In 2025, the Plaquemines LNG facility in Louisiana supplied much of the new volume as it ramped up operations, alongside contributions from Corpus Christi Stage 3. The International Energy Agency estimates that Plaquemines alone was responsible for more than 60% of the global LNG supply increase during the year.
The structure of U.S. LNG contracts has further enhanced their competitiveness. American contracts are frequently linked to domestic natural gas prices and grant buyers greater latitude to redirect cargoes. This flexibility enables customers to route LNG to Europe, Asia, or Latin America based on prevailing prices and demand conditions.
Europe Absorbed the Bulk of Additional Supply
The Energy Information Administration reports that U.S. LNG shipments to Europe averaged a record 10.3 billion cubic feet per day in 2025, a significant increase from 6.3 billion cubic feet per day in 2024. Europe received approximately 68% of total U.S. LNG exports.
The continent continued importing LNG from Russia, Qatar, Algeria, Nigeria, and other suppliers, though none approached the volumes delivered by the United States.
Europe's dependence on imported energy has not disappeared. What has shifted is the mechanism by which gas arrives and the diversity of suppliers competing for European business. Pipeline gas ties a producer and consumer through fixed infrastructure, whereas an LNG cargo can be rerouted mid-voyage. When European prices rise, cargoes initially bound for Asia can be diverted to European terminals.
That flexibility delivers a meaningful layer of energy security—but at a cost. Europe must compete with buyers worldwide for available cargoes, and competition can intensify sharply during a cold winter or a major supply disruption.
Market dynamics favored Europe in 2025. Asian LNG demand softened, and U.S. shipments to China dropped sharply amid trade tensions, freeing additional American cargoes for European buyers willing to pay prevailing rates.
Record Production Underpinned the Surge
U.S. natural gas production reached an all-time high of 103.9 billion cubic feet per day in 2025, an increase of more than 4% over the prior year and representing over 25% of global output. The United States remains by far the world's largest natural gas producer.
The Appalachia region continued as the country's largest single source of natural gas. However, constrained pipeline capacity continues to limit how much additional production can be transported from the region to major demand centers and export terminals.
The Permian Basin contributes substantial volumes of associated natural gas produced alongside crude oil. Because drilling activity there is frequently driven by oil price signals, Permian gas output can keep expanding even when natural gas prices are comparatively weak.
The Haynesville region offers a distinct advantage. Situated in eastern Texas and northern Louisiana, it lies in close proximity to several Gulf Coast LNG terminals, which shortens transportation distances and makes the region particularly responsive to growing export demand.
Crucially, production gains have enabled the United States to scale LNG exports without shortchanging the domestic market. U.S. natural gas consumption also hit a record 88.4 billion cubic feet per day in 2025, while pipeline exports to Mexico continued to serve as another significant outlet.
This is a critical distinction: the LNG boom was not built by slicing a fixed supply across more customers. Producers added enough new output to support rising domestic consumption, pipeline exports, and LNG exports concurrently.
Whether that equilibrium can be sustained will become increasingly consequential. Export capacity is expanding, electricity demand is climbing, and new data centers and industrial facilities are adding load. If production growth and pipeline construction fail to keep pace, domestic prices will absorb more of the pressure from overseas demand.
LNG Is Restructuring Global Gas Trade
The transition toward LNG extends well beyond America's ascent. Interregional LNG trade grew approximately 6.5% in 2025, while interregional pipeline trade contracted by roughly 3.6%. LNG now accounts for about 55% of interregional natural gas trade, compared with less than 40% a decade ago.
Natural gas was once predominantly a regional commodity, with prices in North America, Europe, and Asia capable of moving independently due to limited cross-market infrastructure. LNG has eroded those boundaries—a disruption in one region can now influence prices elsewhere by altering cargo destinations. The global gas market is not yet as integrated as the oil market, but it is trending in that direction.
Recent disruptions to LNG flows through the Strait of Hormuz have underscored the strategic value of supply sourced from outside the Persian Gulf. The IEA estimates that LNG transiting the strait had represented nearly 20% of global supply prior to the 2026 disruption.
For American producers, these dynamics open access to a substantially larger customer base. For domestic consumers, they mean U.S. prices will grow more sensitive to global supply conditions, weather events, and geopolitical developments.
More U.S. Capacity Is on the Horizon
The 2025 increase was not an isolated jump. Multiple U.S. terminals are still ramping up, and several others are under construction.
U.S. LNG exports are projected to average approximately 17 billion cubic feet per day in 2026, with further gains expected in 2027 as additional capacity comes online. Corpus Christi Stage 3 and Plaquemines will continue their expansion, while Golden Pass, Port Arthur, and Rio Grande LNG represent the next wave of large-scale projects.
Projects representing more than 2.8 trillion cubic feet of annual export capacity reached final investment decisions during 2025. The IEA expects the United States to account for roughly one-third of the global LNG market by the end of the decade.
Constraints remain. LNG terminals demand billions of dollars in capital investment and years of construction. They also depend on pipeline networks capable of delivering enormous volumes of feed gas. Developers must maintain confidence that overseas customers will fulfill long-term commitments and that global demand will hold firm.
The implications for U.S. prices warrant attention as well. LNG exports open a lucrative market for producers, but each additional terminal introduces another source of demand. Consumers have benefited from abundant, low-cost natural gas for years, and sustained production growth will be essential to preserving that advantage.
The Broader Picture
In 2025, the United States did more than lead the world in both natural gas production and LNG exports—it supplied nearly all of the market's growth. That is the most definitive indicator of how central U.S. natural gas has become to the global energy landscape.
Qatar and Australia remain significant exporters, but neither is currently scaling supply at a comparable rate. For now, the global LNG market depends on the United States to satisfy the majority of its incremental demand, and with additional Gulf Coast capacity nearing completion, that role appears set to expand further.
By Robert Rapier

